Help Tutorial
ImmCeRNAp is a database for the prediction and evaluation of immune-related ceRNAs for personalized treatment and prognosis of pan-cancer. ImmCeRNA provides a variety of flexible online analysis tools, including ImmCeRNA-Differential expression, ImmCeRNA-Immune infiltration, ImmCeRNA-Function, ImmCeRNA-Immunotherapy, ImmCeRNA-Drug sensitivity, ImmCeRNA-Survival, and ImmCeRNA-Patient-specific analysis to characterize the associations between immune-related ceRNAs with expression, immunity, drug responses, immunotherapy, and prognosis in a cancer-specific, pan-cancer comparative, and patient individual-specific manner. ImmCeRNA will help to discover novel and sensitive biomarkers and immunotherapeutic targets in human cancers, and provide important support for predicting the efficacy of individualized immunotherapy and elucidating therapeutic resistance mechanisms.
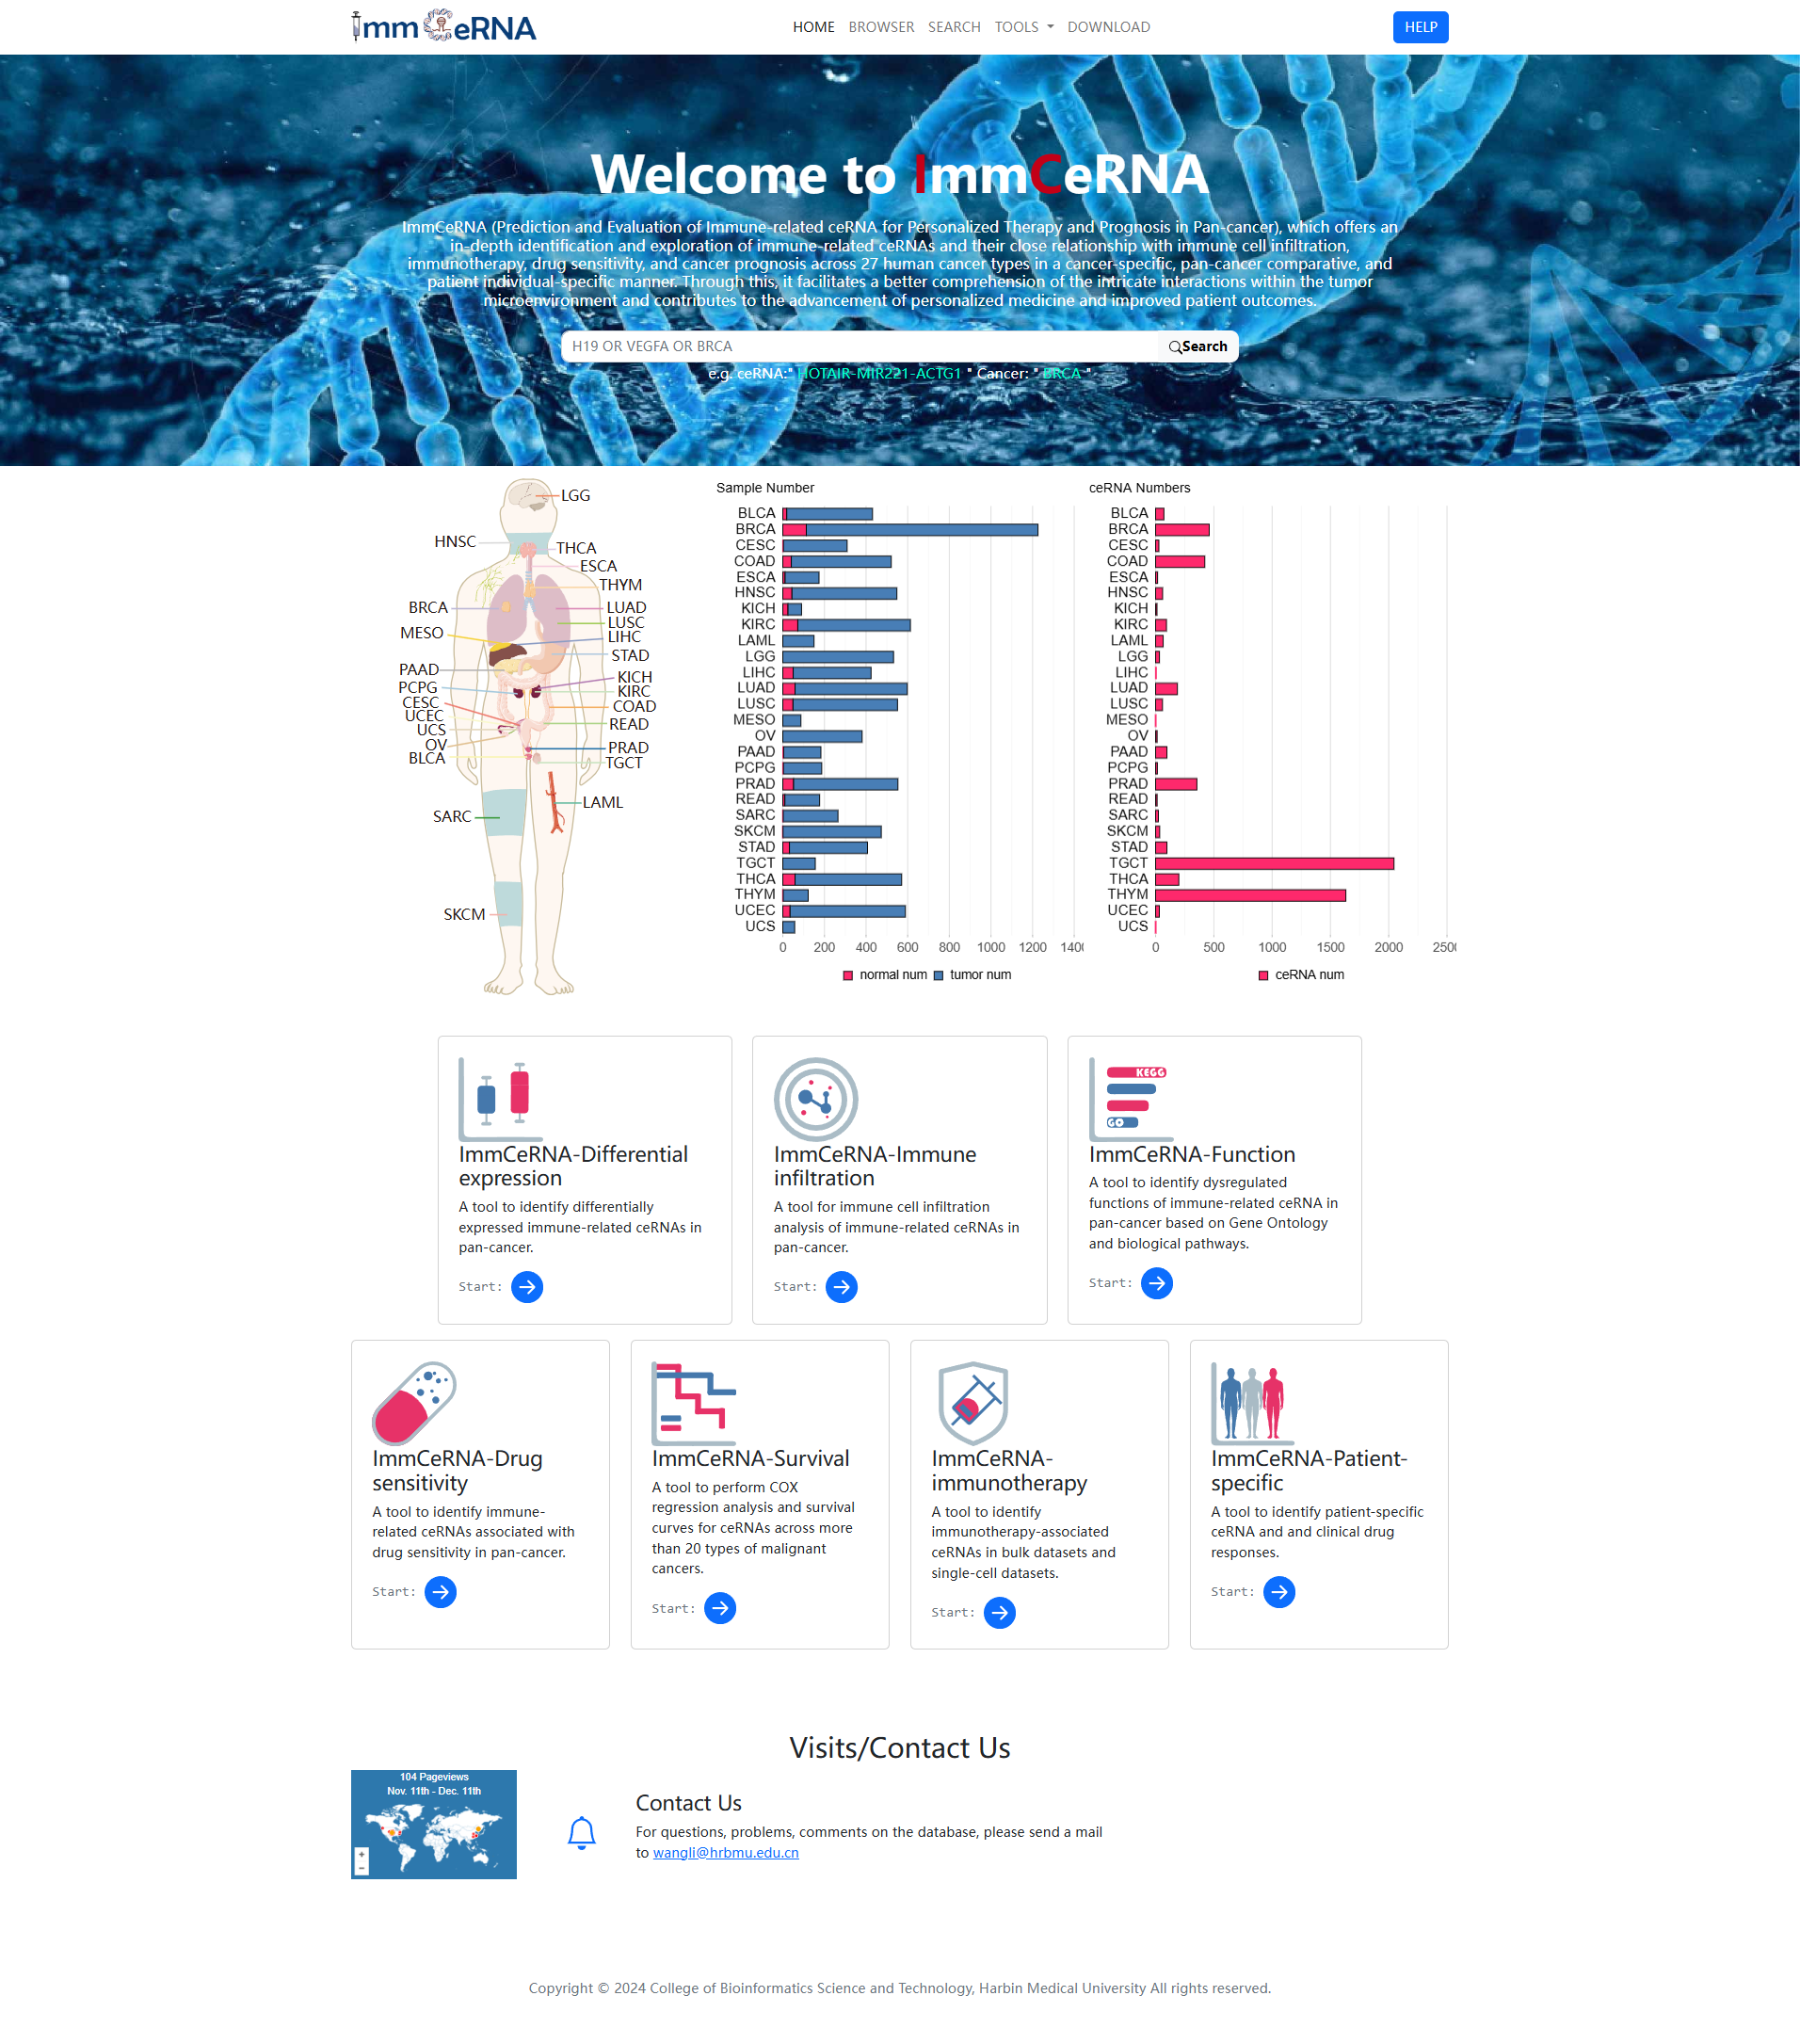
The Home page is displayed in Figure 1-1:
1.Main functions of the database are
provided in menu bar form (boxed in red).
2.The brief introduction of ImmCeRNA.
3.
Main data information for ImmCeRNA.
4. The analysis tools in ImmCeRNA.
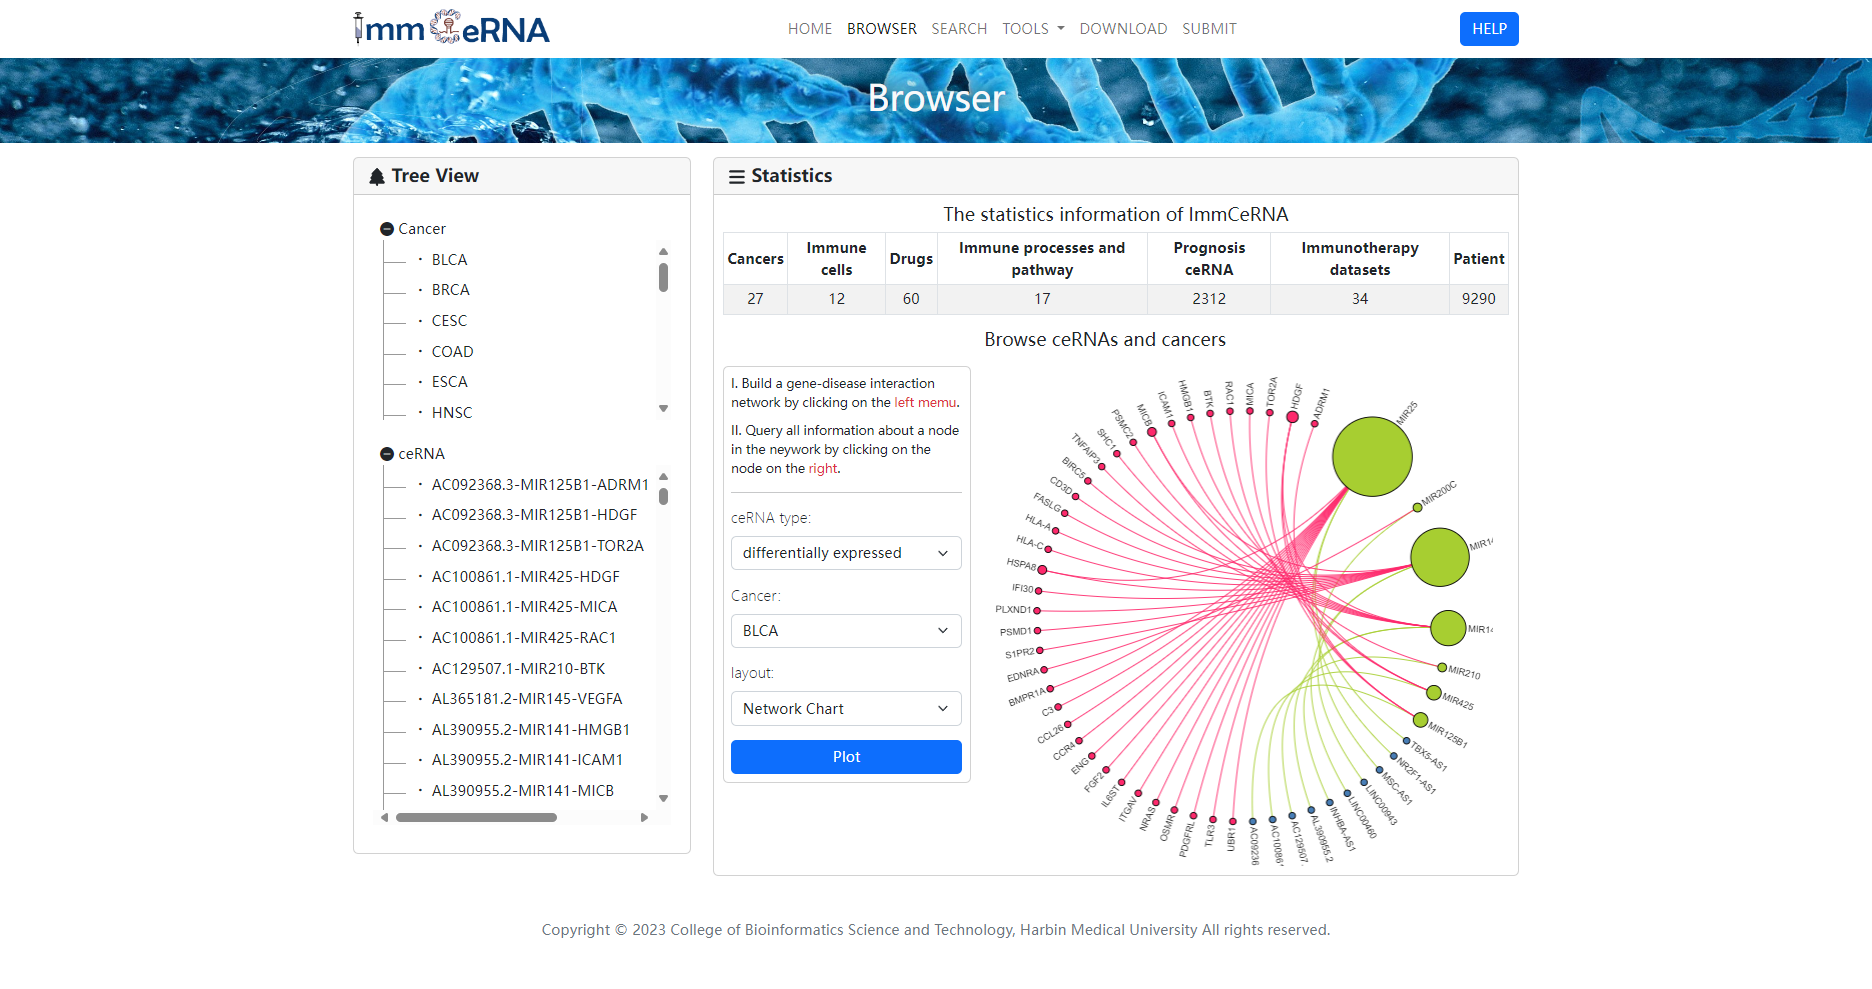
The browse page is built based on human cancer and Immune-related ceRNA. To browse the ceRNAs related a particular cancer (such as Breast cancer), please click “Cancer”, then choose “BRCA”. The breastcancer-related ceRNAs will be returned. Similarly, the users can browse for cancers associated with ceRNA of interest in a similar way. In addition, users can build a ceRNA network by selecting the ceRNA type and cancer.
User can query the ImmCeRNA database through Advanced Search. Advanced search provides multiple options for customized search of the interested contents. Users can query the interested ceRNAs by combining different key words, including cancer, ceRNA and Analysis.

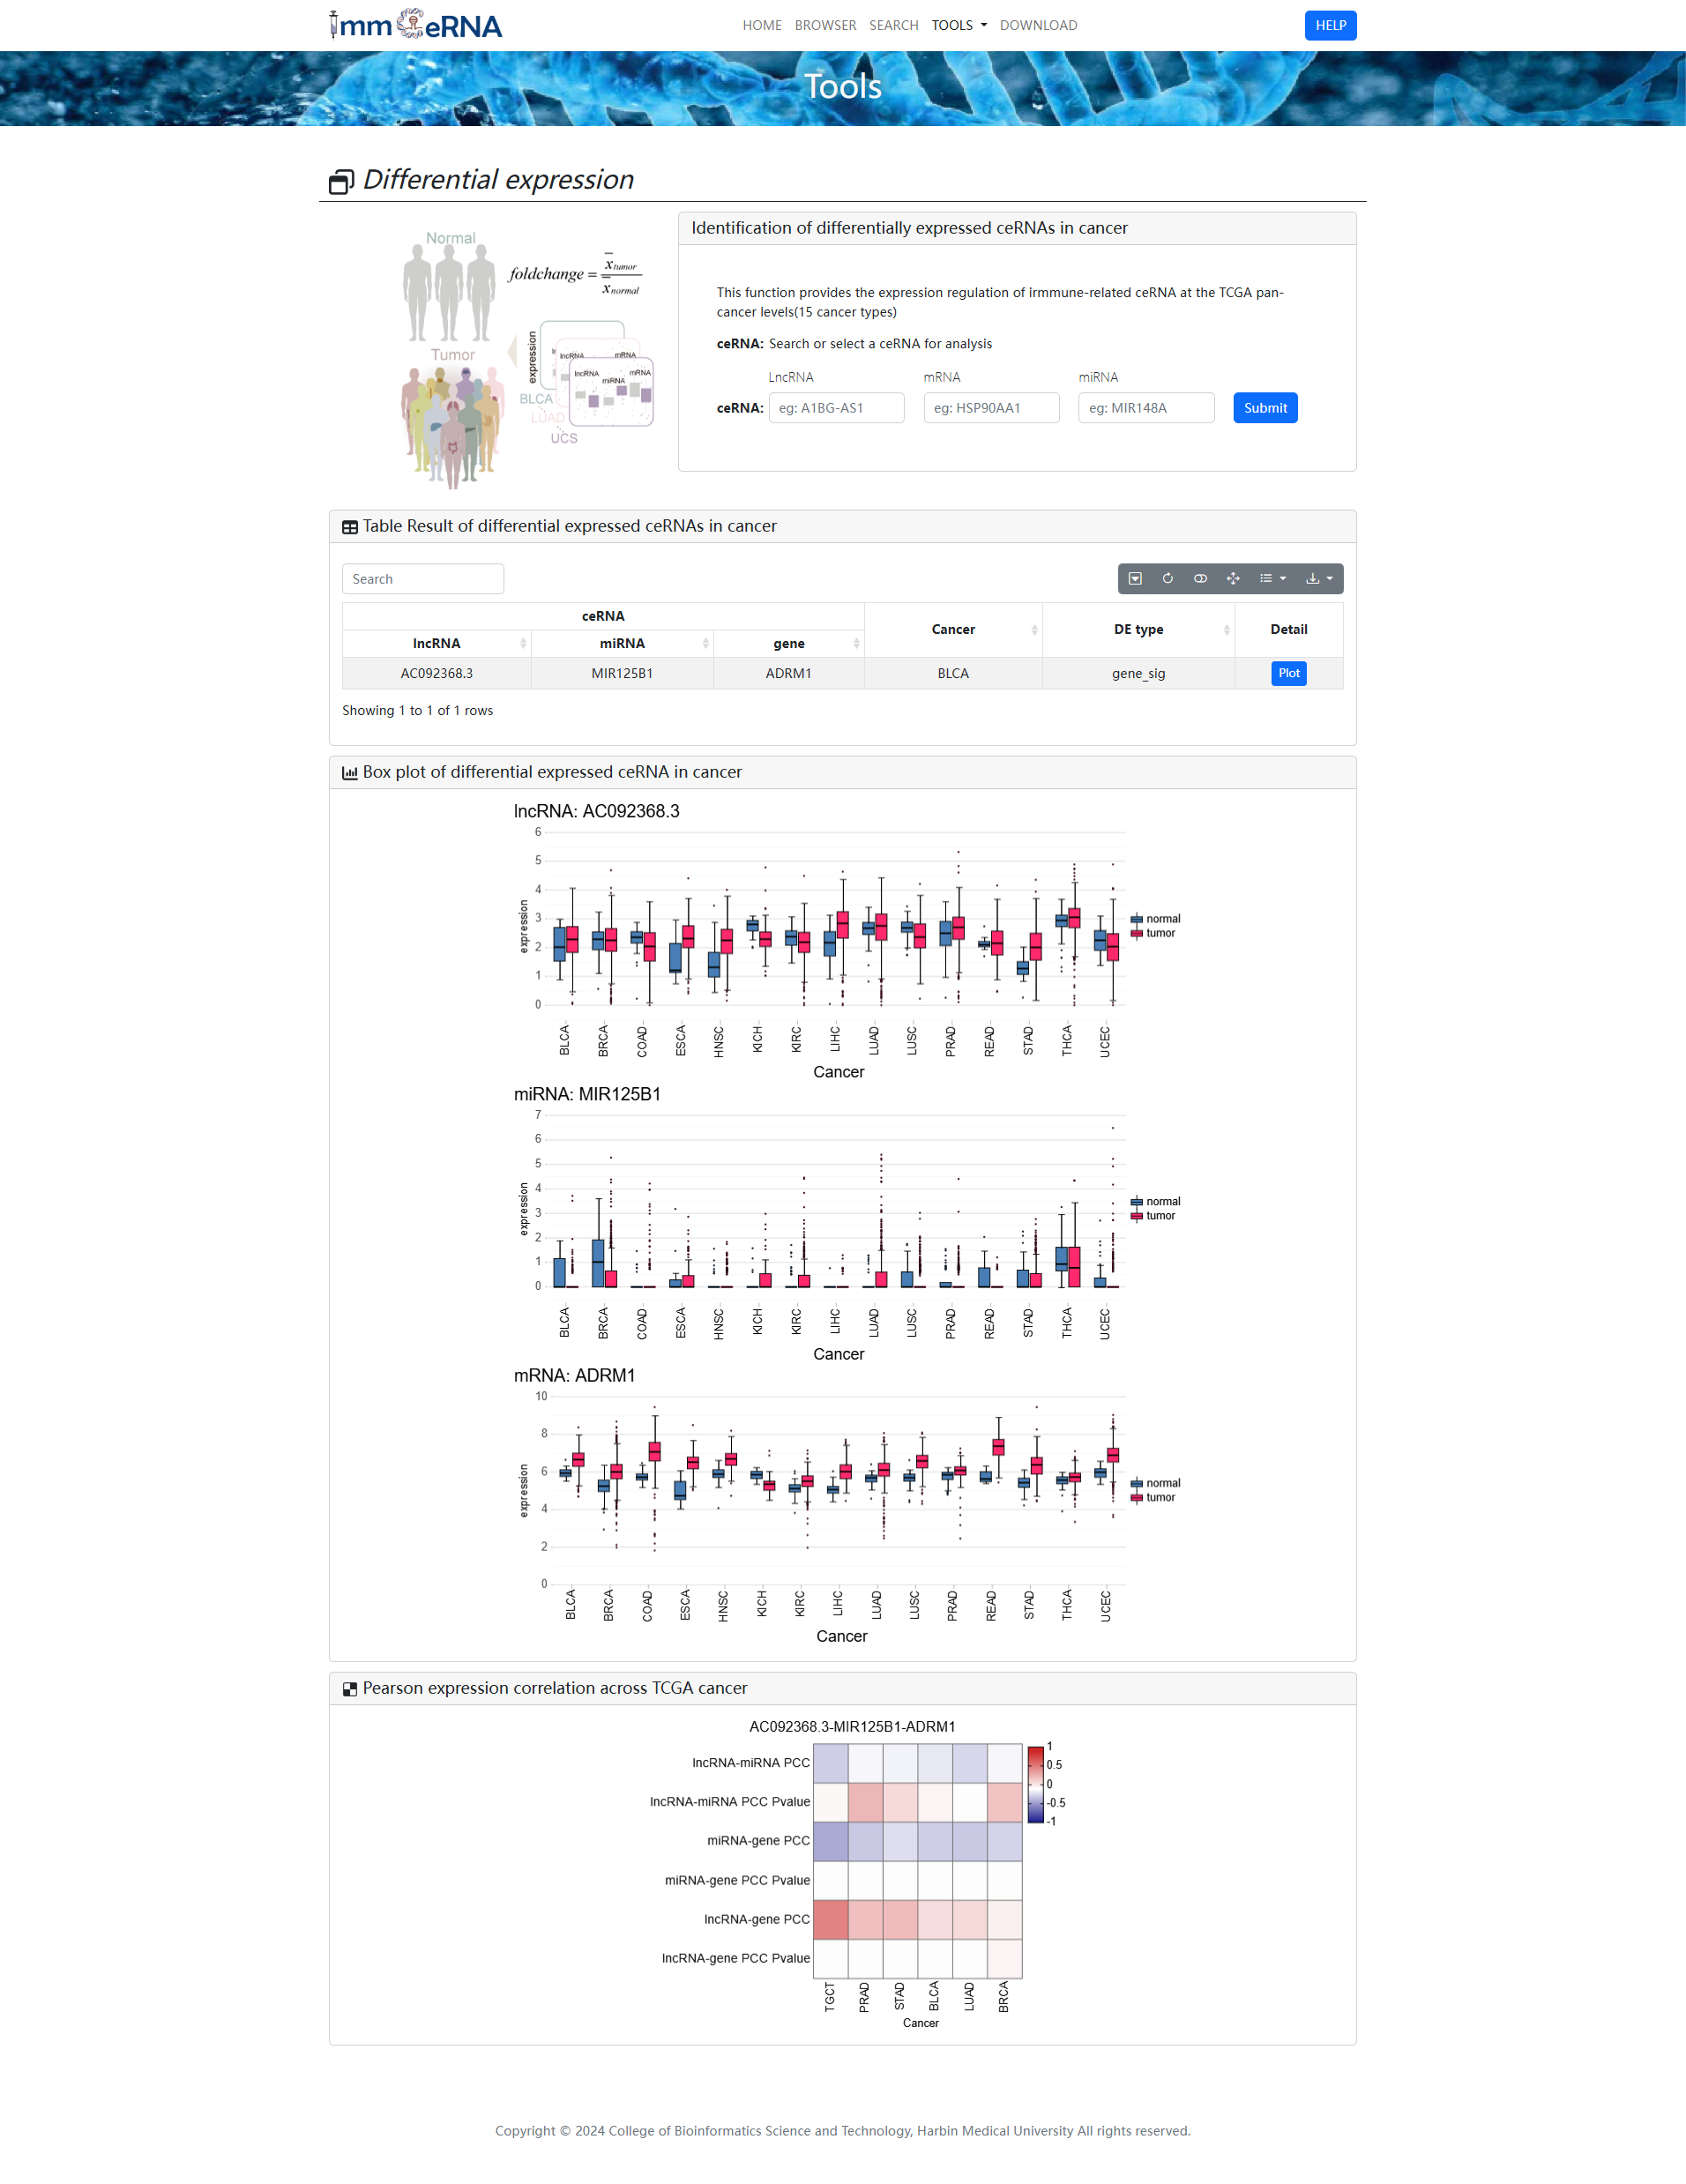
1) Differential expression
This function provides the
expression regulation of immune-related ceRNA at the TCGA pan-cancer levels (15 cancer types).
To identify differentially expressed ceRNAs in cancer, you should search or select a cancer
or/and ceRNA for analysis first, and then click the “Submit” button to retrieve the
differentially expressed ceRNAs. The box plot shown differential expressed ceRNA in cancer. The
heat map shown pearson expression correlation across TCGA cancer.
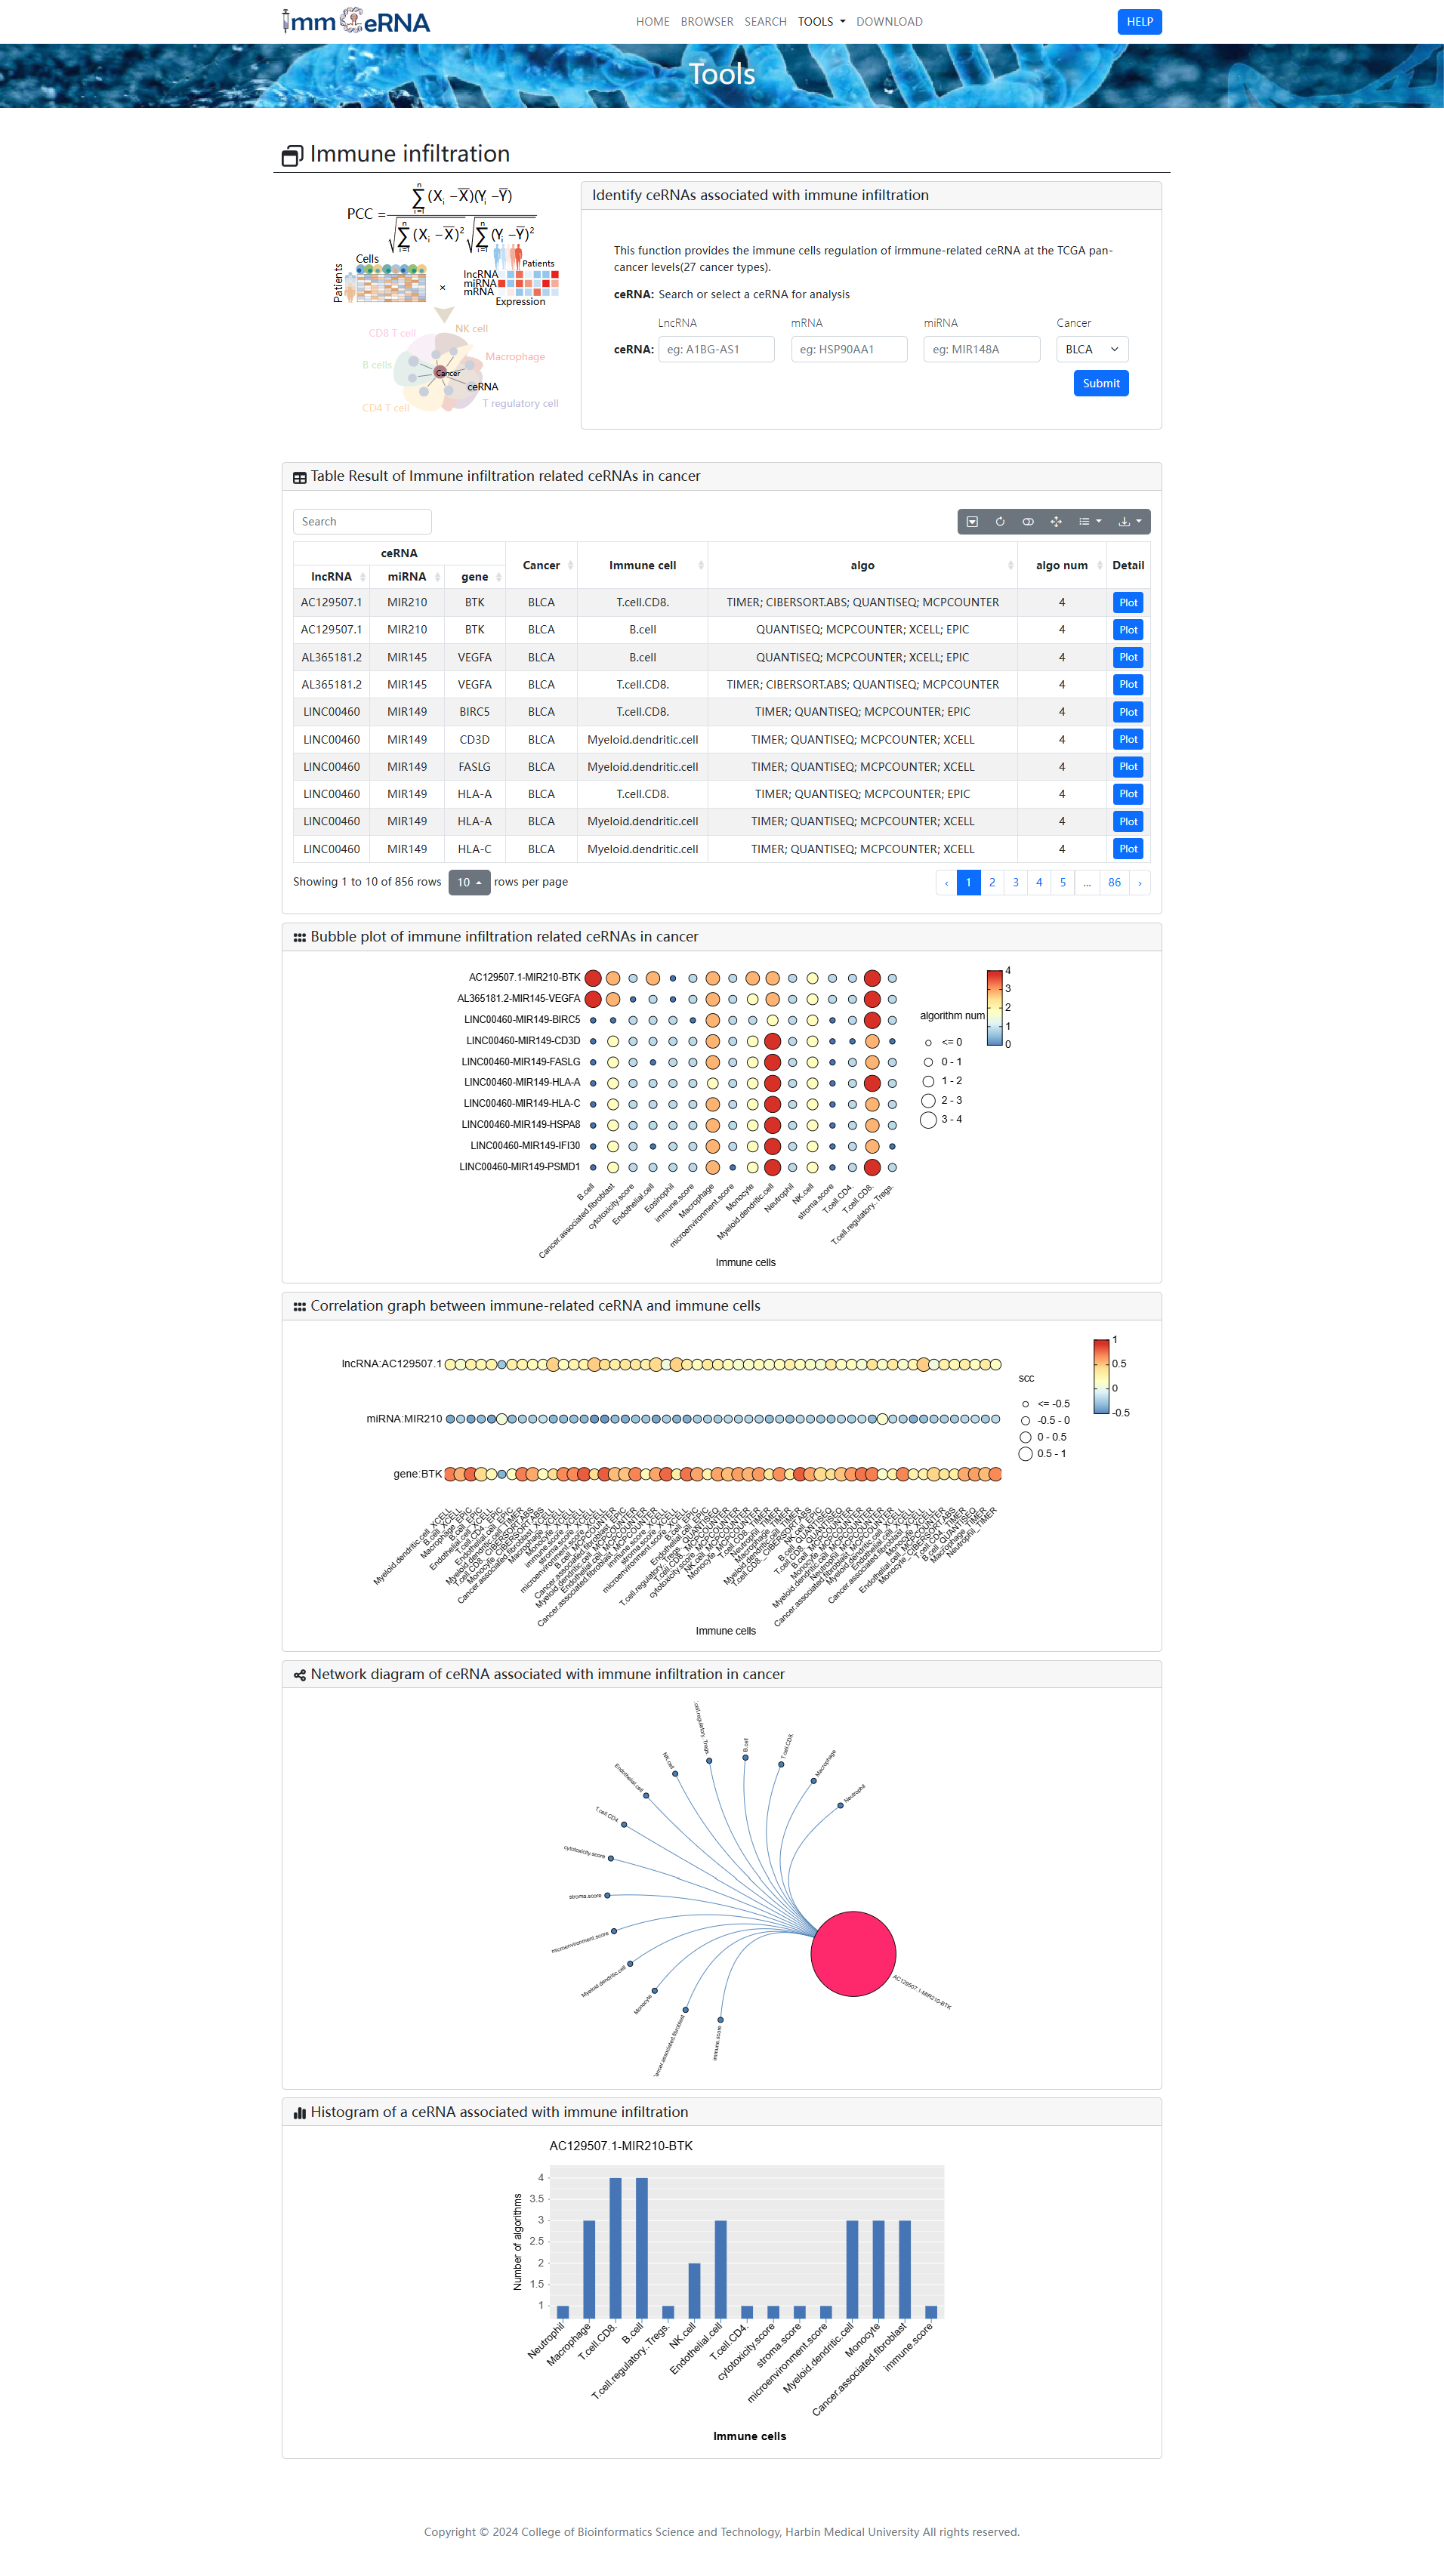
2) Immune infiltration
This function provides the immune cells
regulation of
immune-related ceRNA at the TCGA pan-cancer levels (26 cancer types). To identify ceRNAs
associated with immune
infiltration, you should search or select a cancer or/and ceRNA for analysis first, and then
click the “Submit”
button to retrieve the ceRNAs associated with immune infiltration. The bubble plot shown immune
infiltration
related ceRNAs in cancer and correlation graph between immune-related ceRNA and immune cells.
Network diagram
shown ceRNA associated with immune infiltration in cancer. Histogram shown a ceRNA associated
with immune
infiltration.
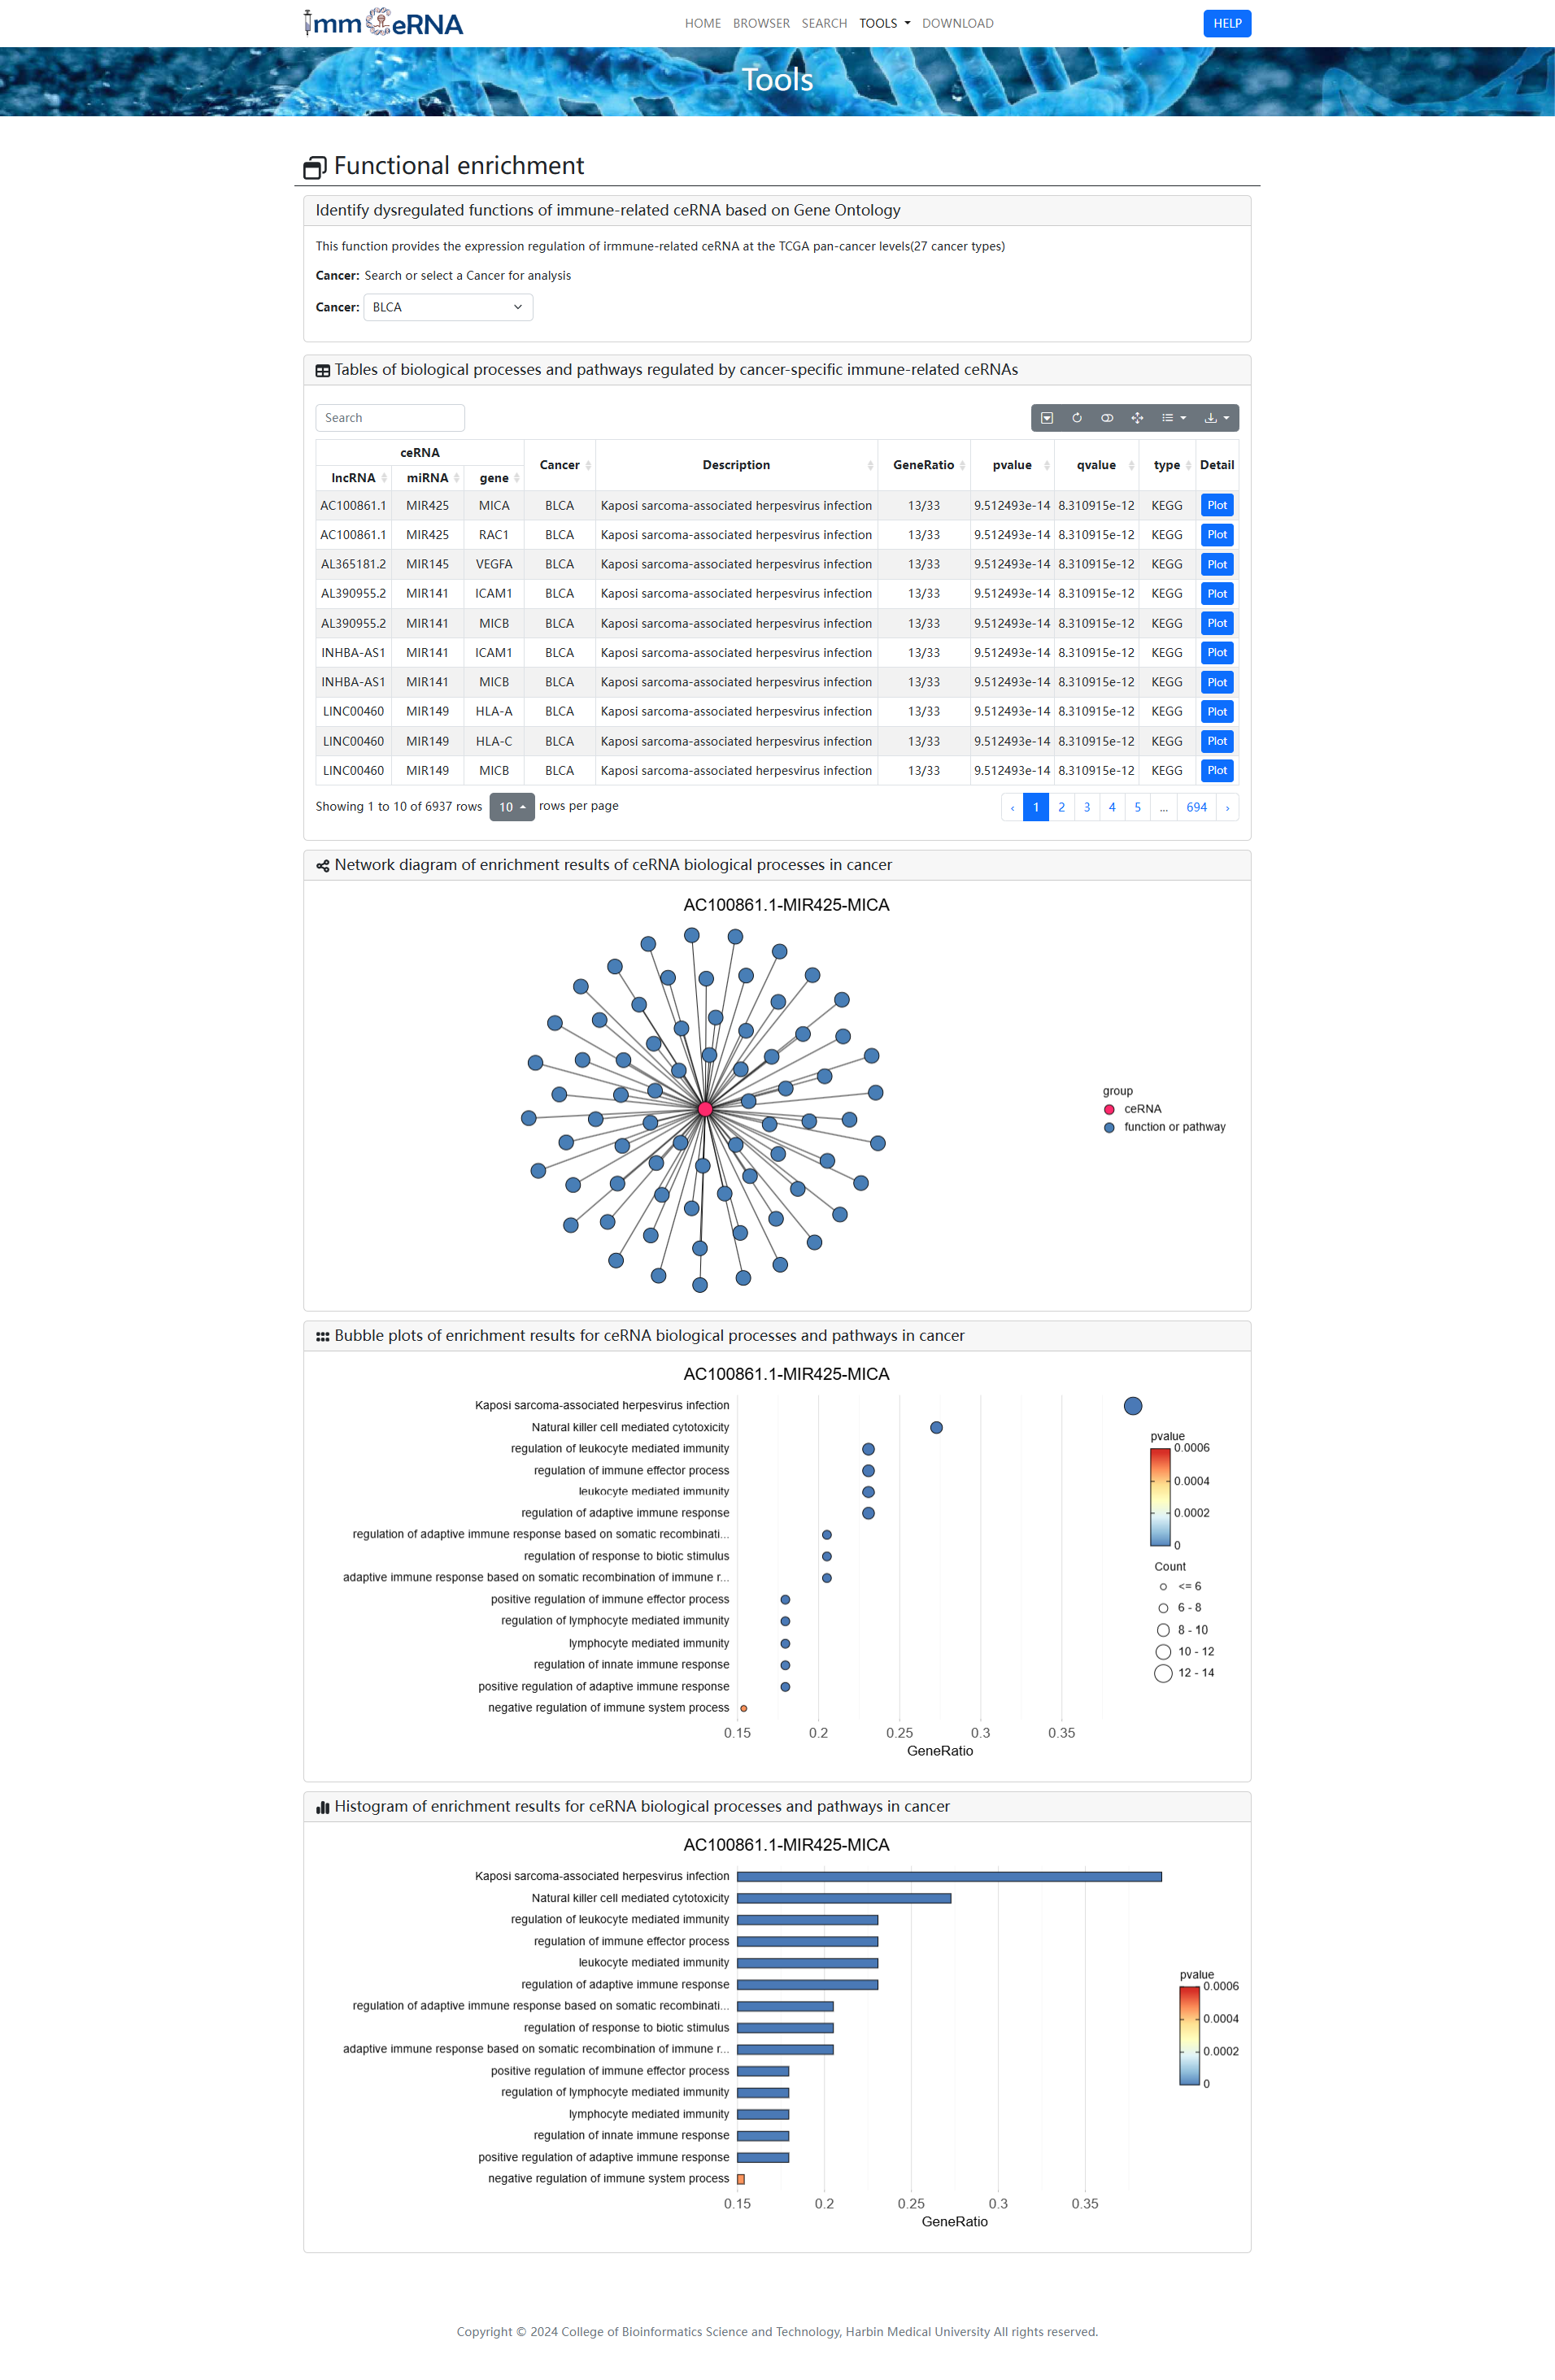
3) Functional enrichment
This function provides the expression
regulation of irmmune-related ceRNA at the TCGA pan-cancer levels (27 cancer types). To identify
dysregulated functions of immune-related ceRNA based on Gene Ontology and KEGG pathways, you
should search or select a cancer for analysis first, and then click the “Submit” button. Network
diagram showing the regulatory relationship between cancer-specific ceRNAs and biological
processes or pathways. Bubble map and histogram shown enrichment results of cancer-specific
ceRNA.
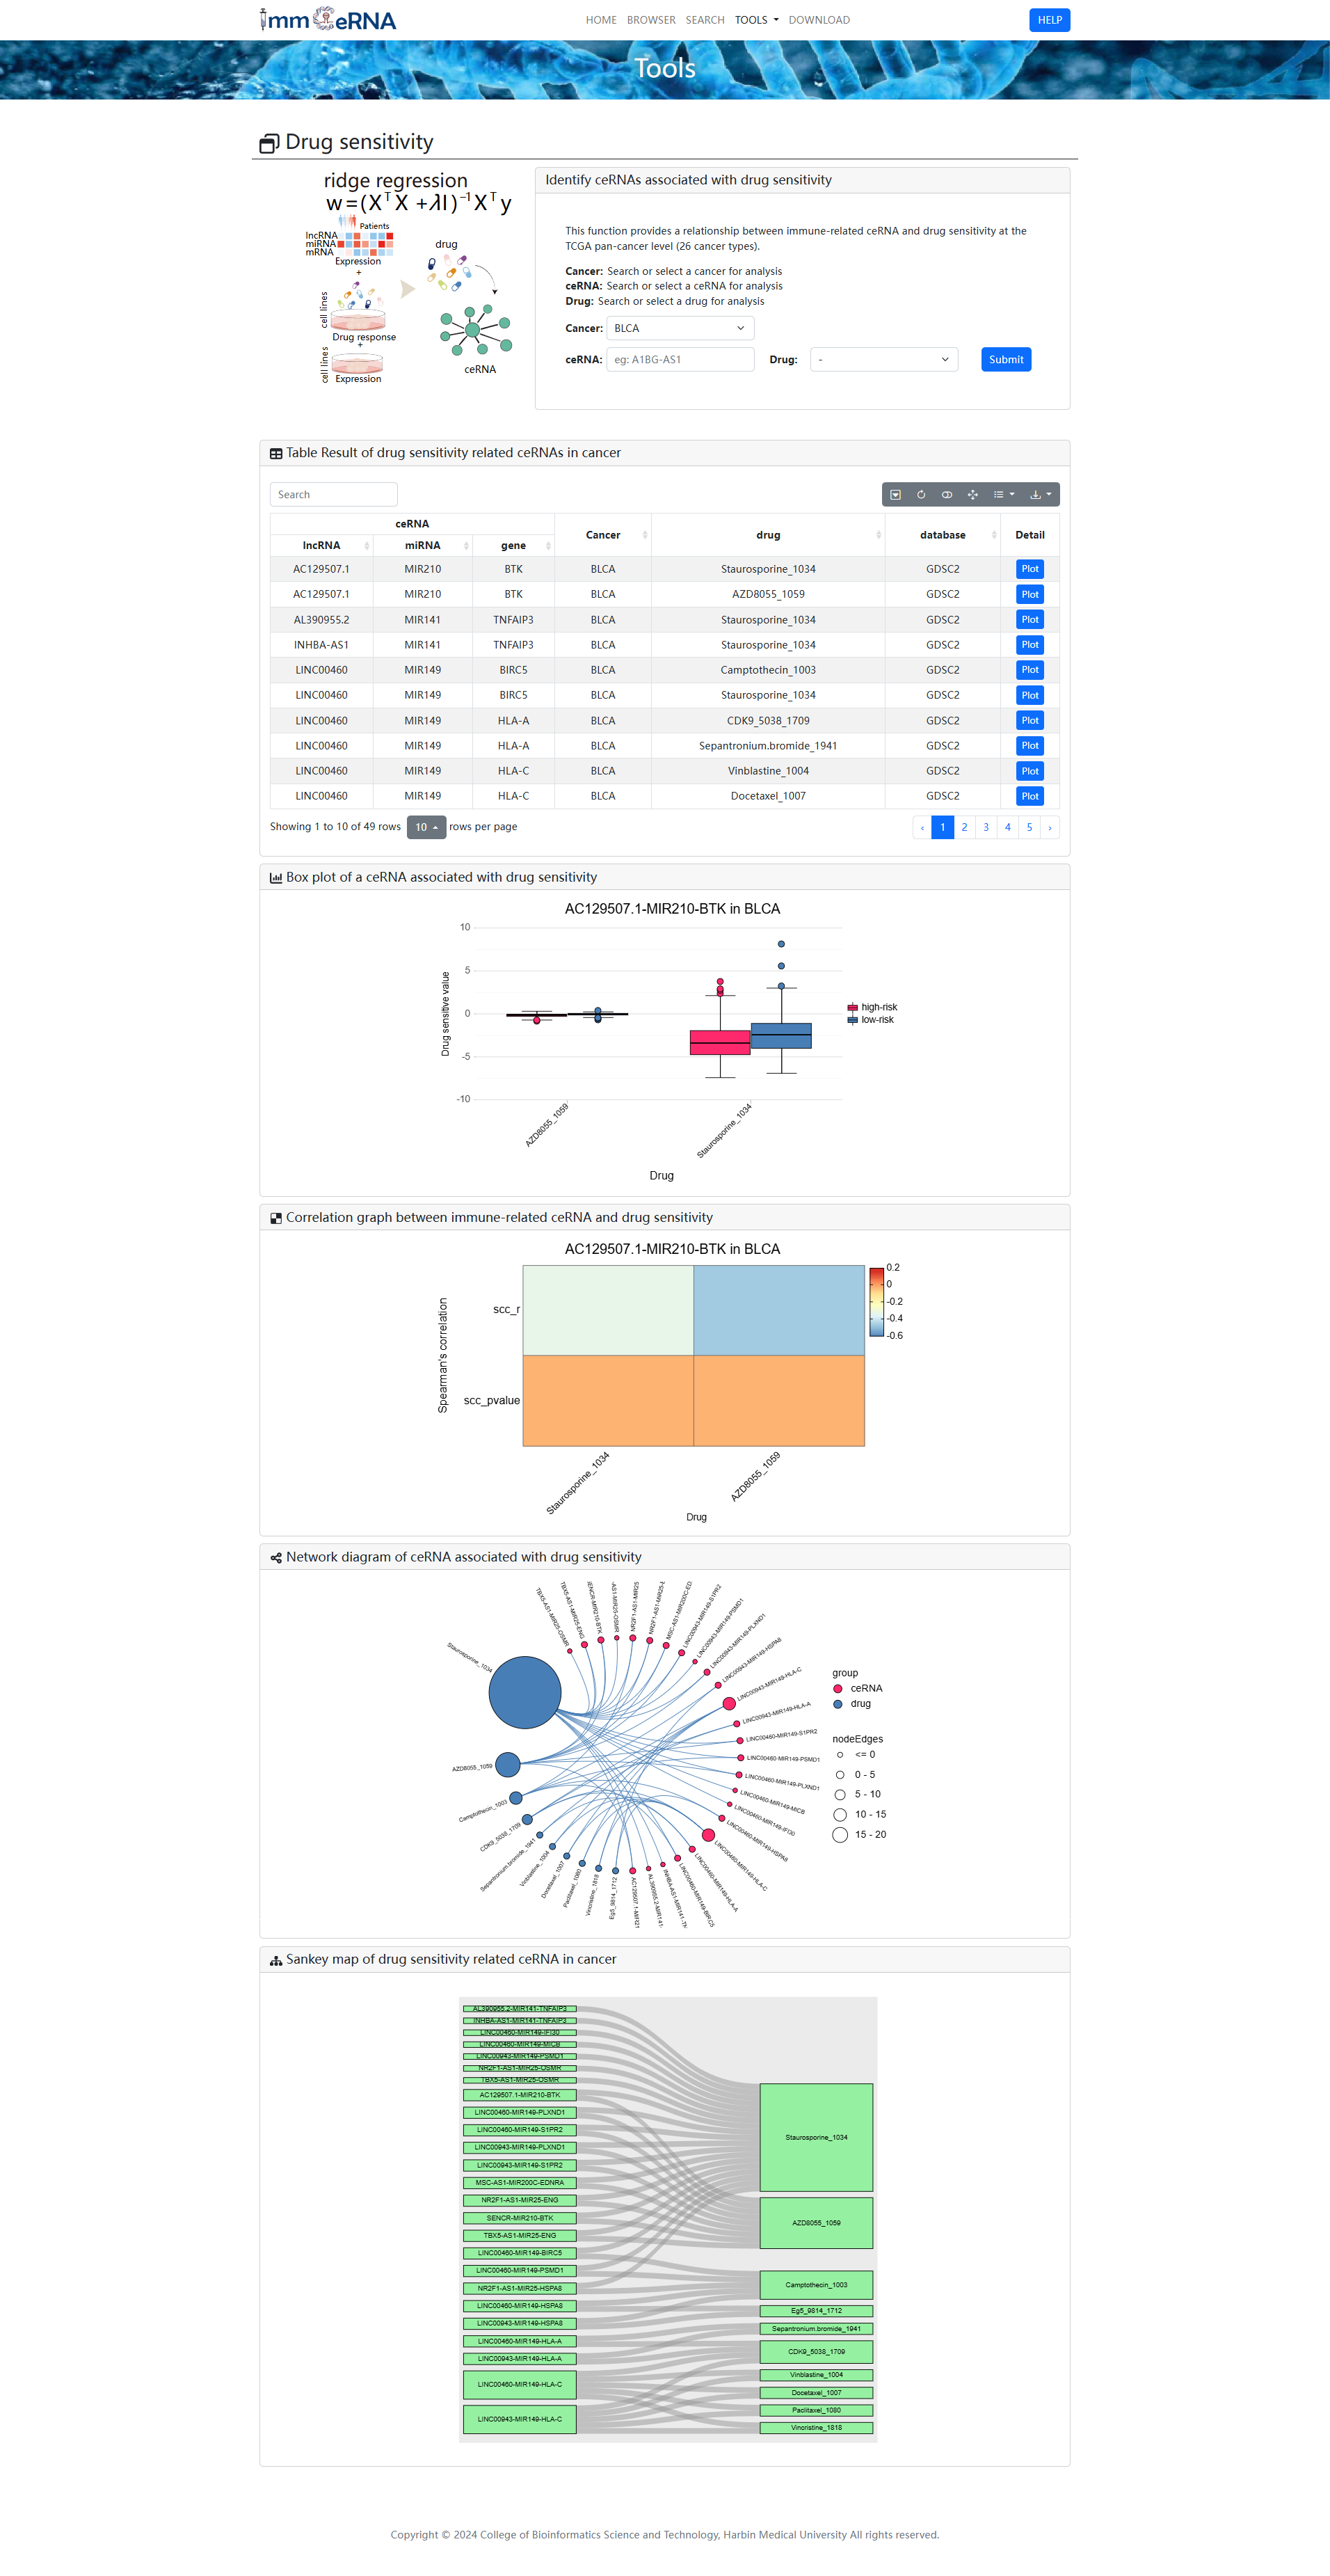
4) Drug sensitivity
This function provides a relationship
between immune-related ceRNA and drug sensitivity at the TCGA pan-cancer level (26 cancer
types). To identify ceRNAs associated with drug sensitivity, you should search or select a
ceRNA, cancer and/or drug for analysis first, and then click the “Submit” button to retrieve the
ceRNAs associated with drug sensitivity. Box plots show the relationship between selected
immune-related ceRNAs and drugs in selected cancers. Correlation plots show the correlation
between immune-related ceRNAs and drug sensitivity. Network and Sankey plots show the ceRNAs
associated with drug sensitivity in selected cancers.
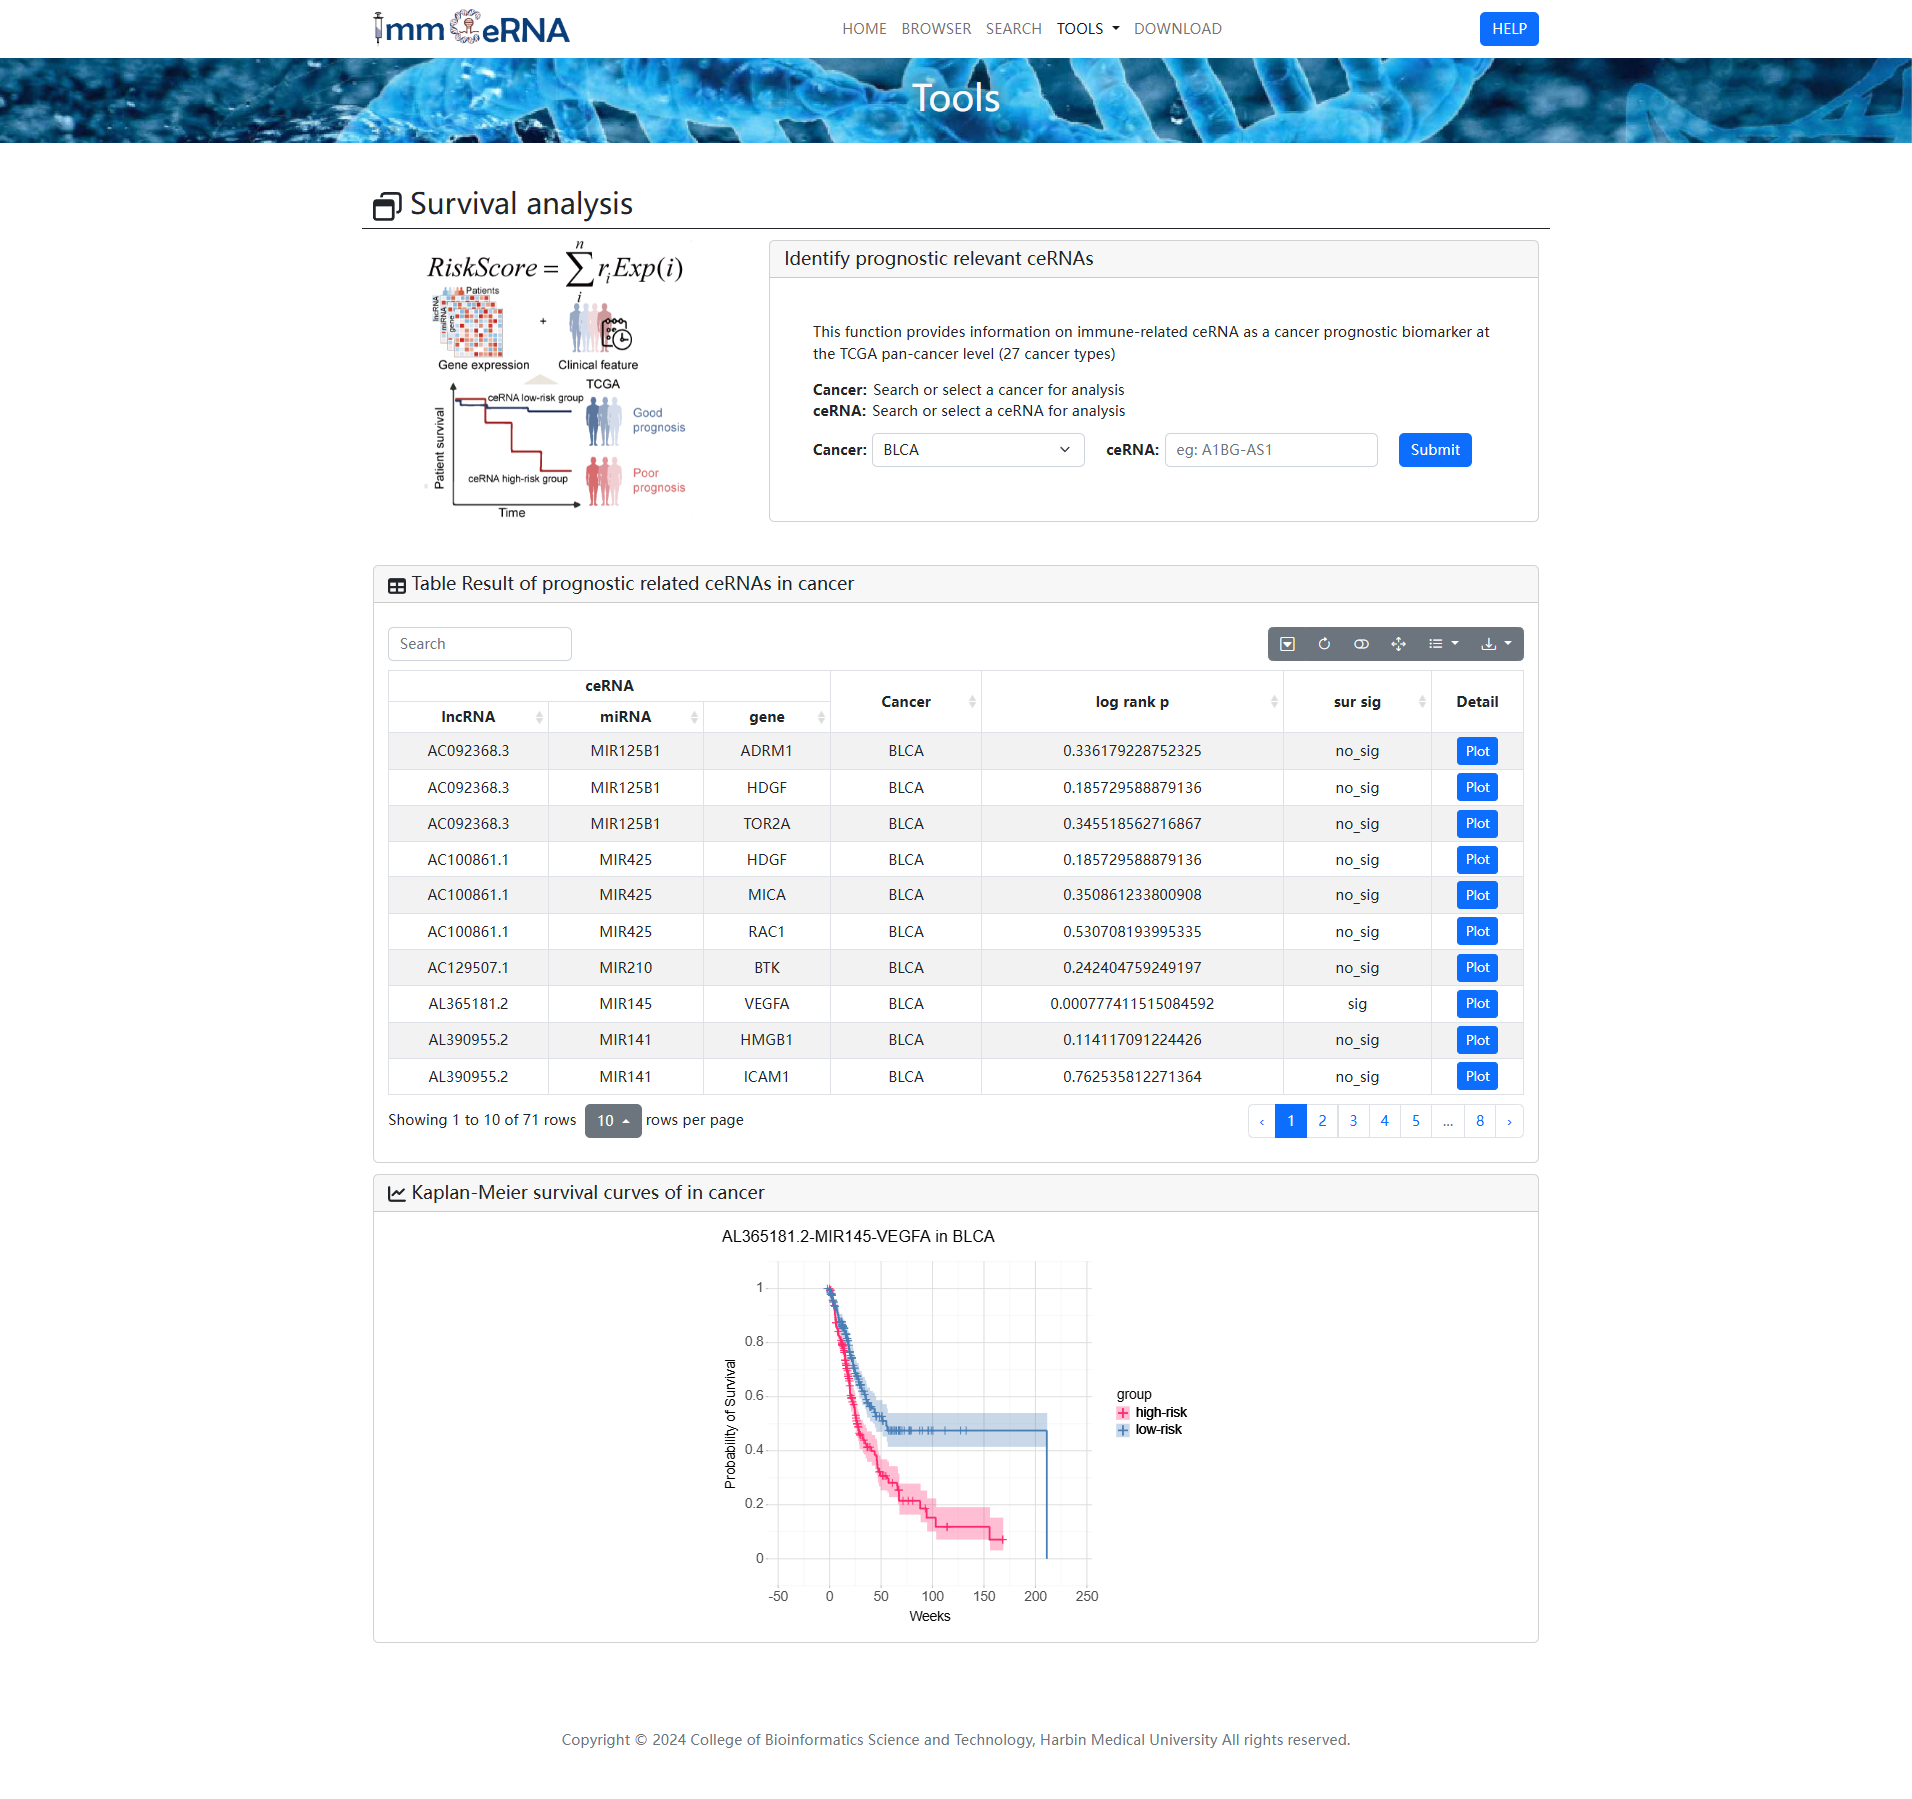
5) Survival analysis
This function provides information on
immune-related ceRNA as a cancer prognostic biomarker at the TCGA pan-cancer level (27 cancer
types). To identify prognostic relevant ceRNAs, you should search or select a ceRNA and cancer
for analysis first, and then click the “Submit” button to retrieve the prognostic relevant
ceRNAs. Kaplan-Meier survival curve shown the relationship between ceRNAs and patient prognosis
in cancer.
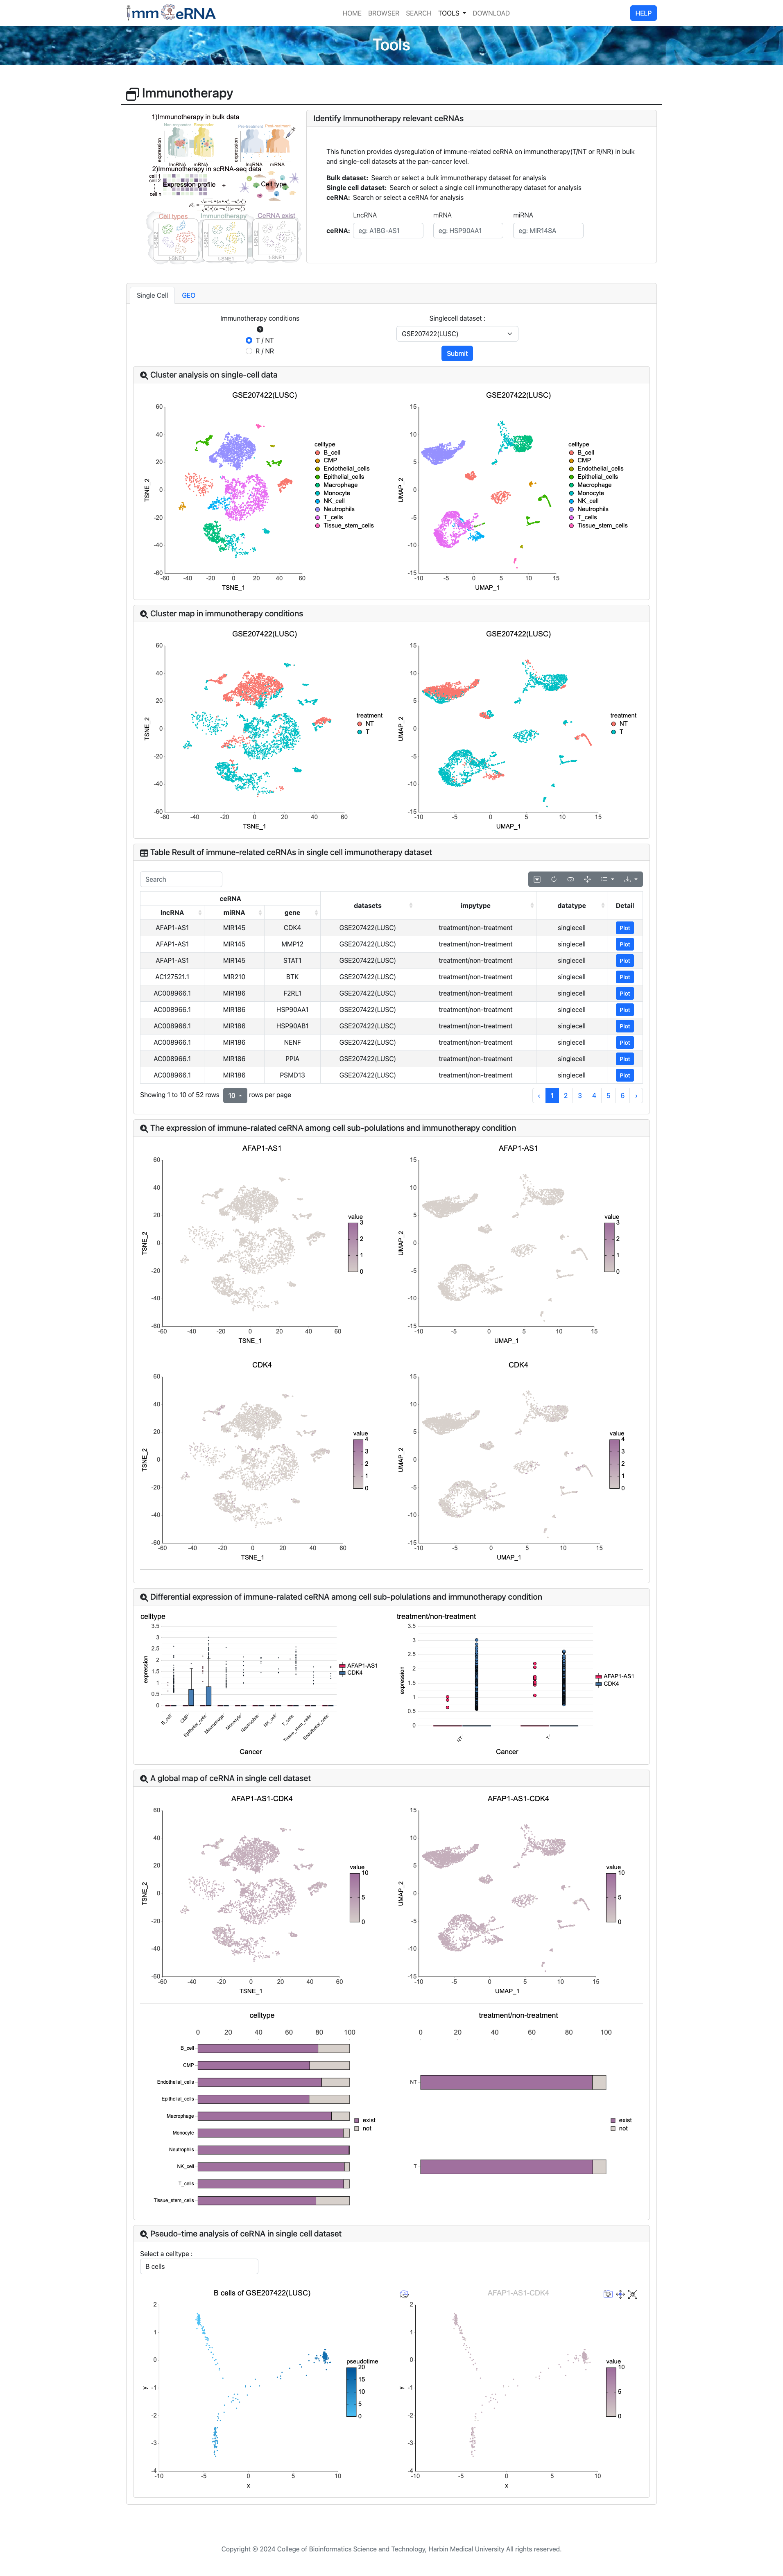
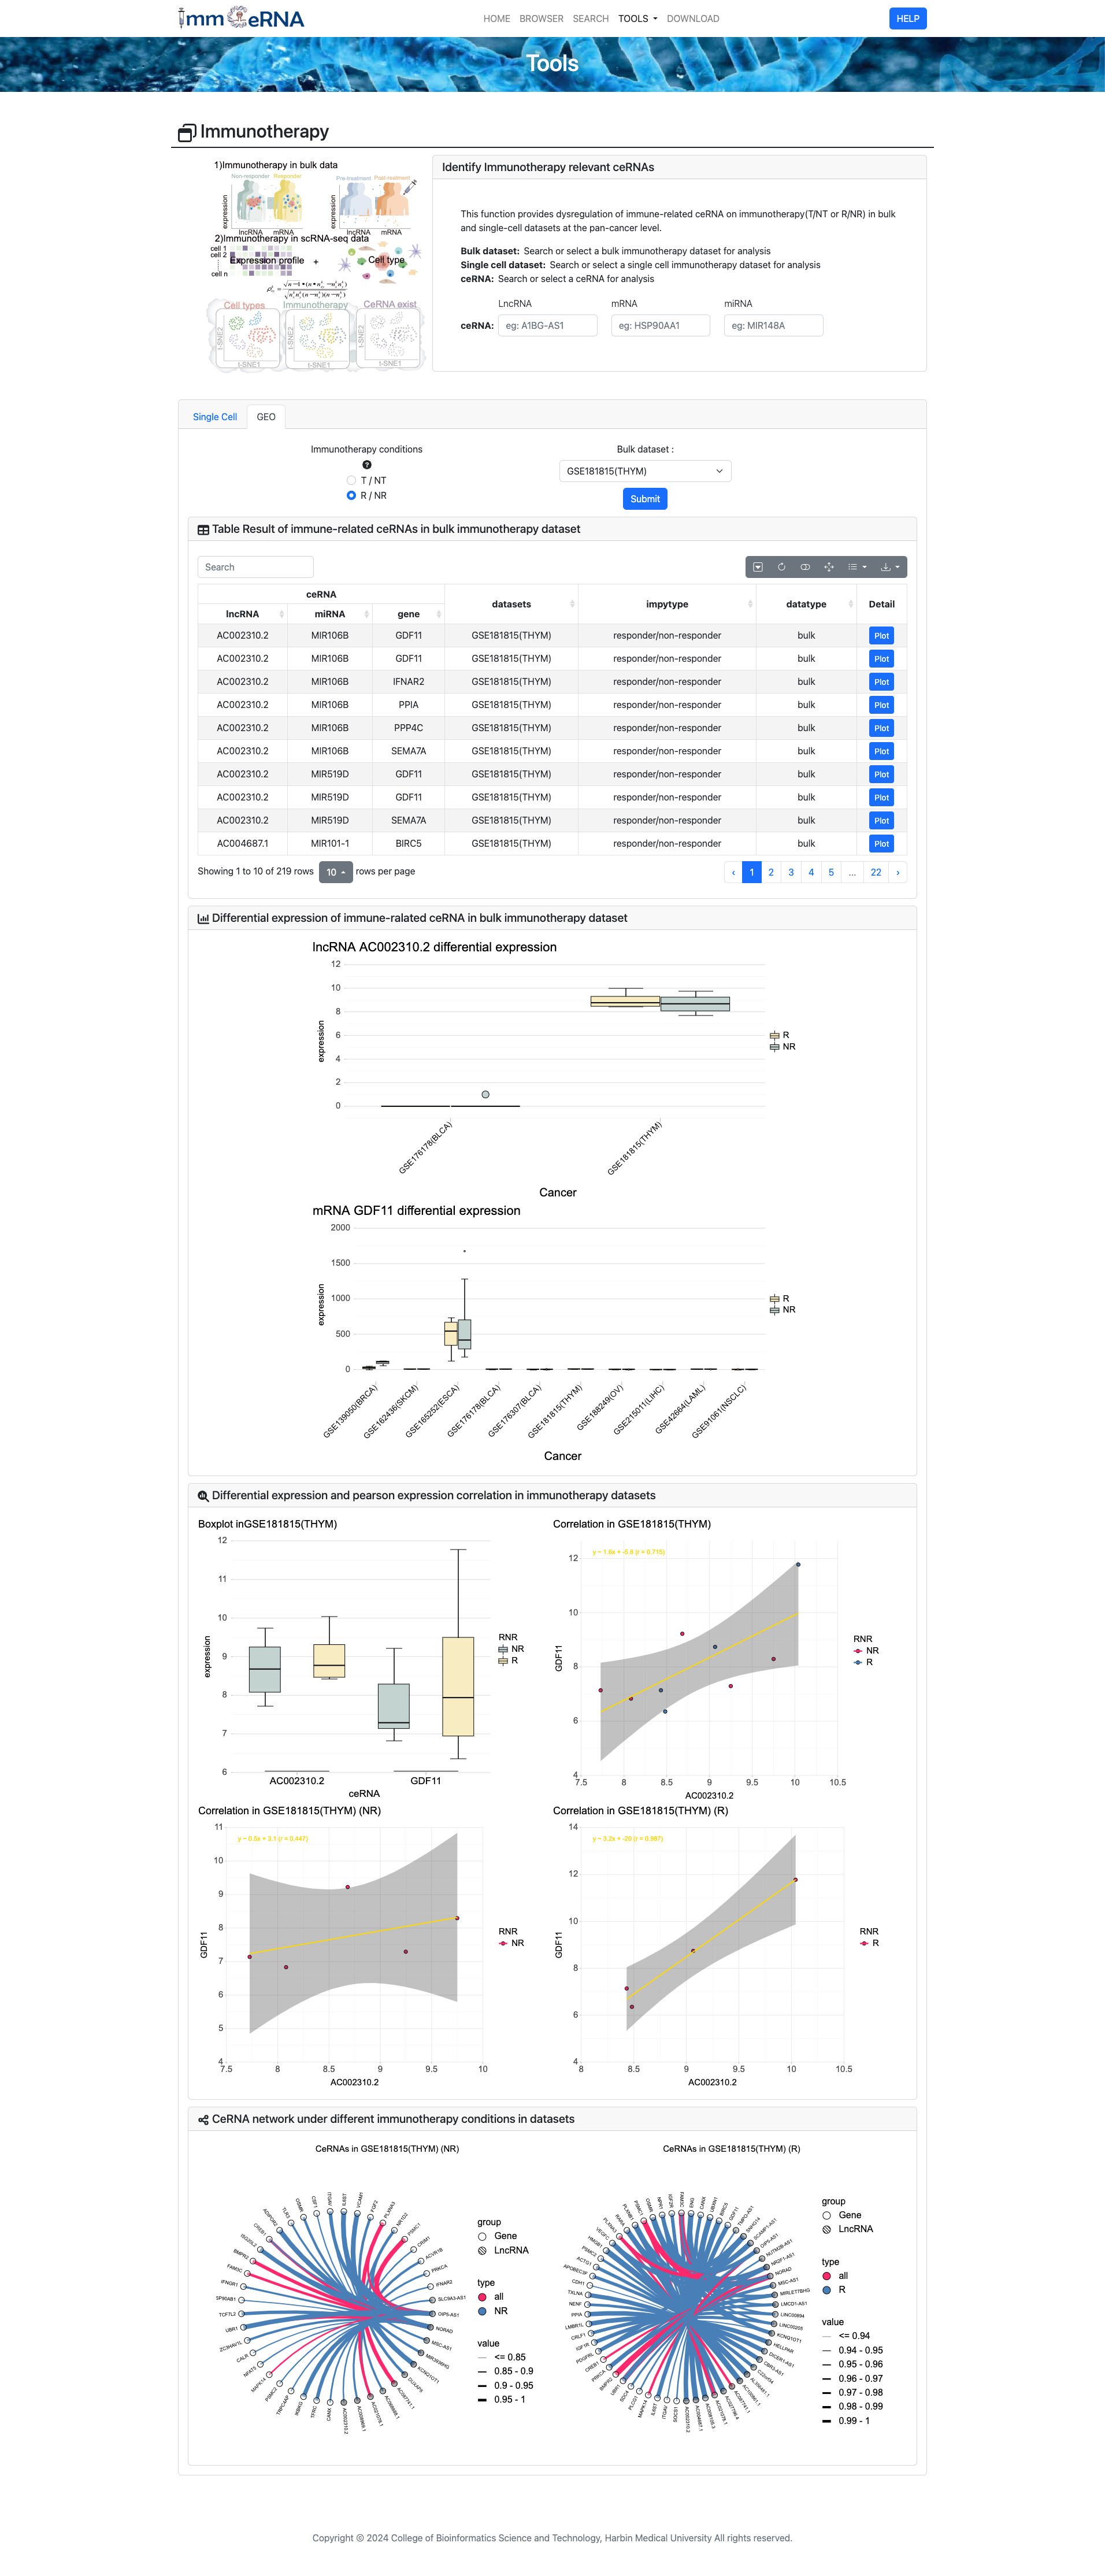
6) Immunotherapy
This function provides dysregulation of immune-related
ceRNA on immunotherapy (T/NT or R/NR) in bulk and single-cell datasets at the pan-cancer level. For bulk sequencing
data, bar graphs display immunotherapy-related ceRNAs in pan-cancer and ceRNA expression under different
immunotherapies, along with the change network of ceRNAs in various states within the dataset. For single-cell
sequencing data, TSNE plots illustrate the distribution of cell types, immunotherapy status, regulation of
immune-related ceRNAs in individual cells, and pseudotemporal analysis is also included.
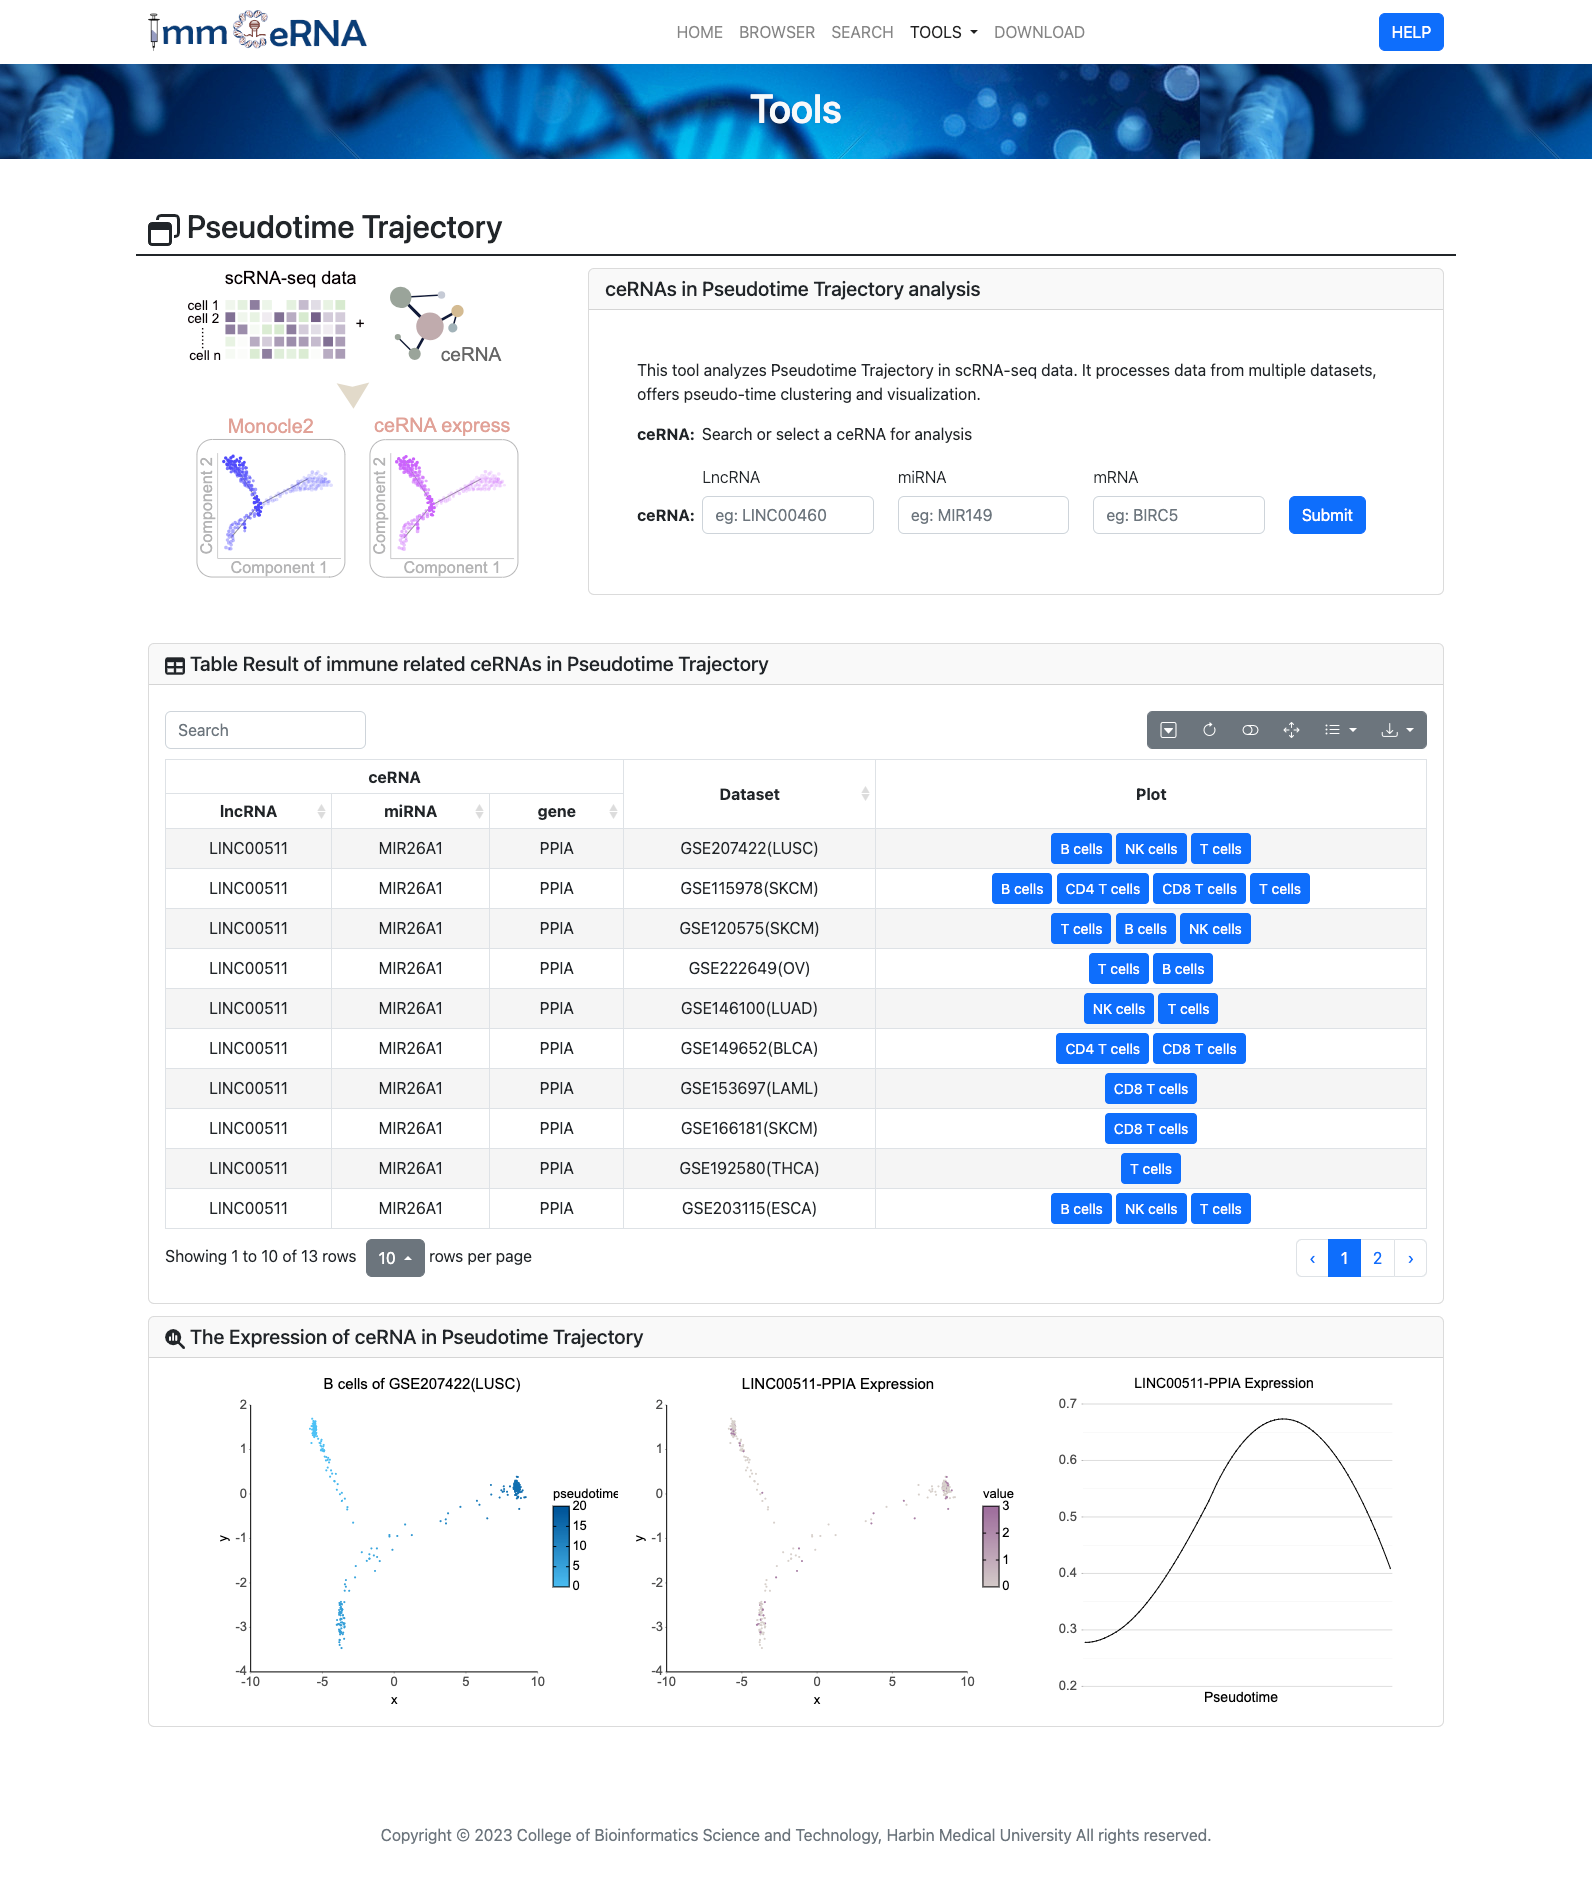
7) Pseudotime Trajectory
This tool analyzes Pseudotime Trajectory in
scRNA-seq data, integrating multiple datasets. Users configure parameters, click “Submit” for analysis, and get
pseudo-time clustering results visualized via trajectory plots and diagrams. In cancer research, it
reveals tumor cell development paths for targeted therapies.
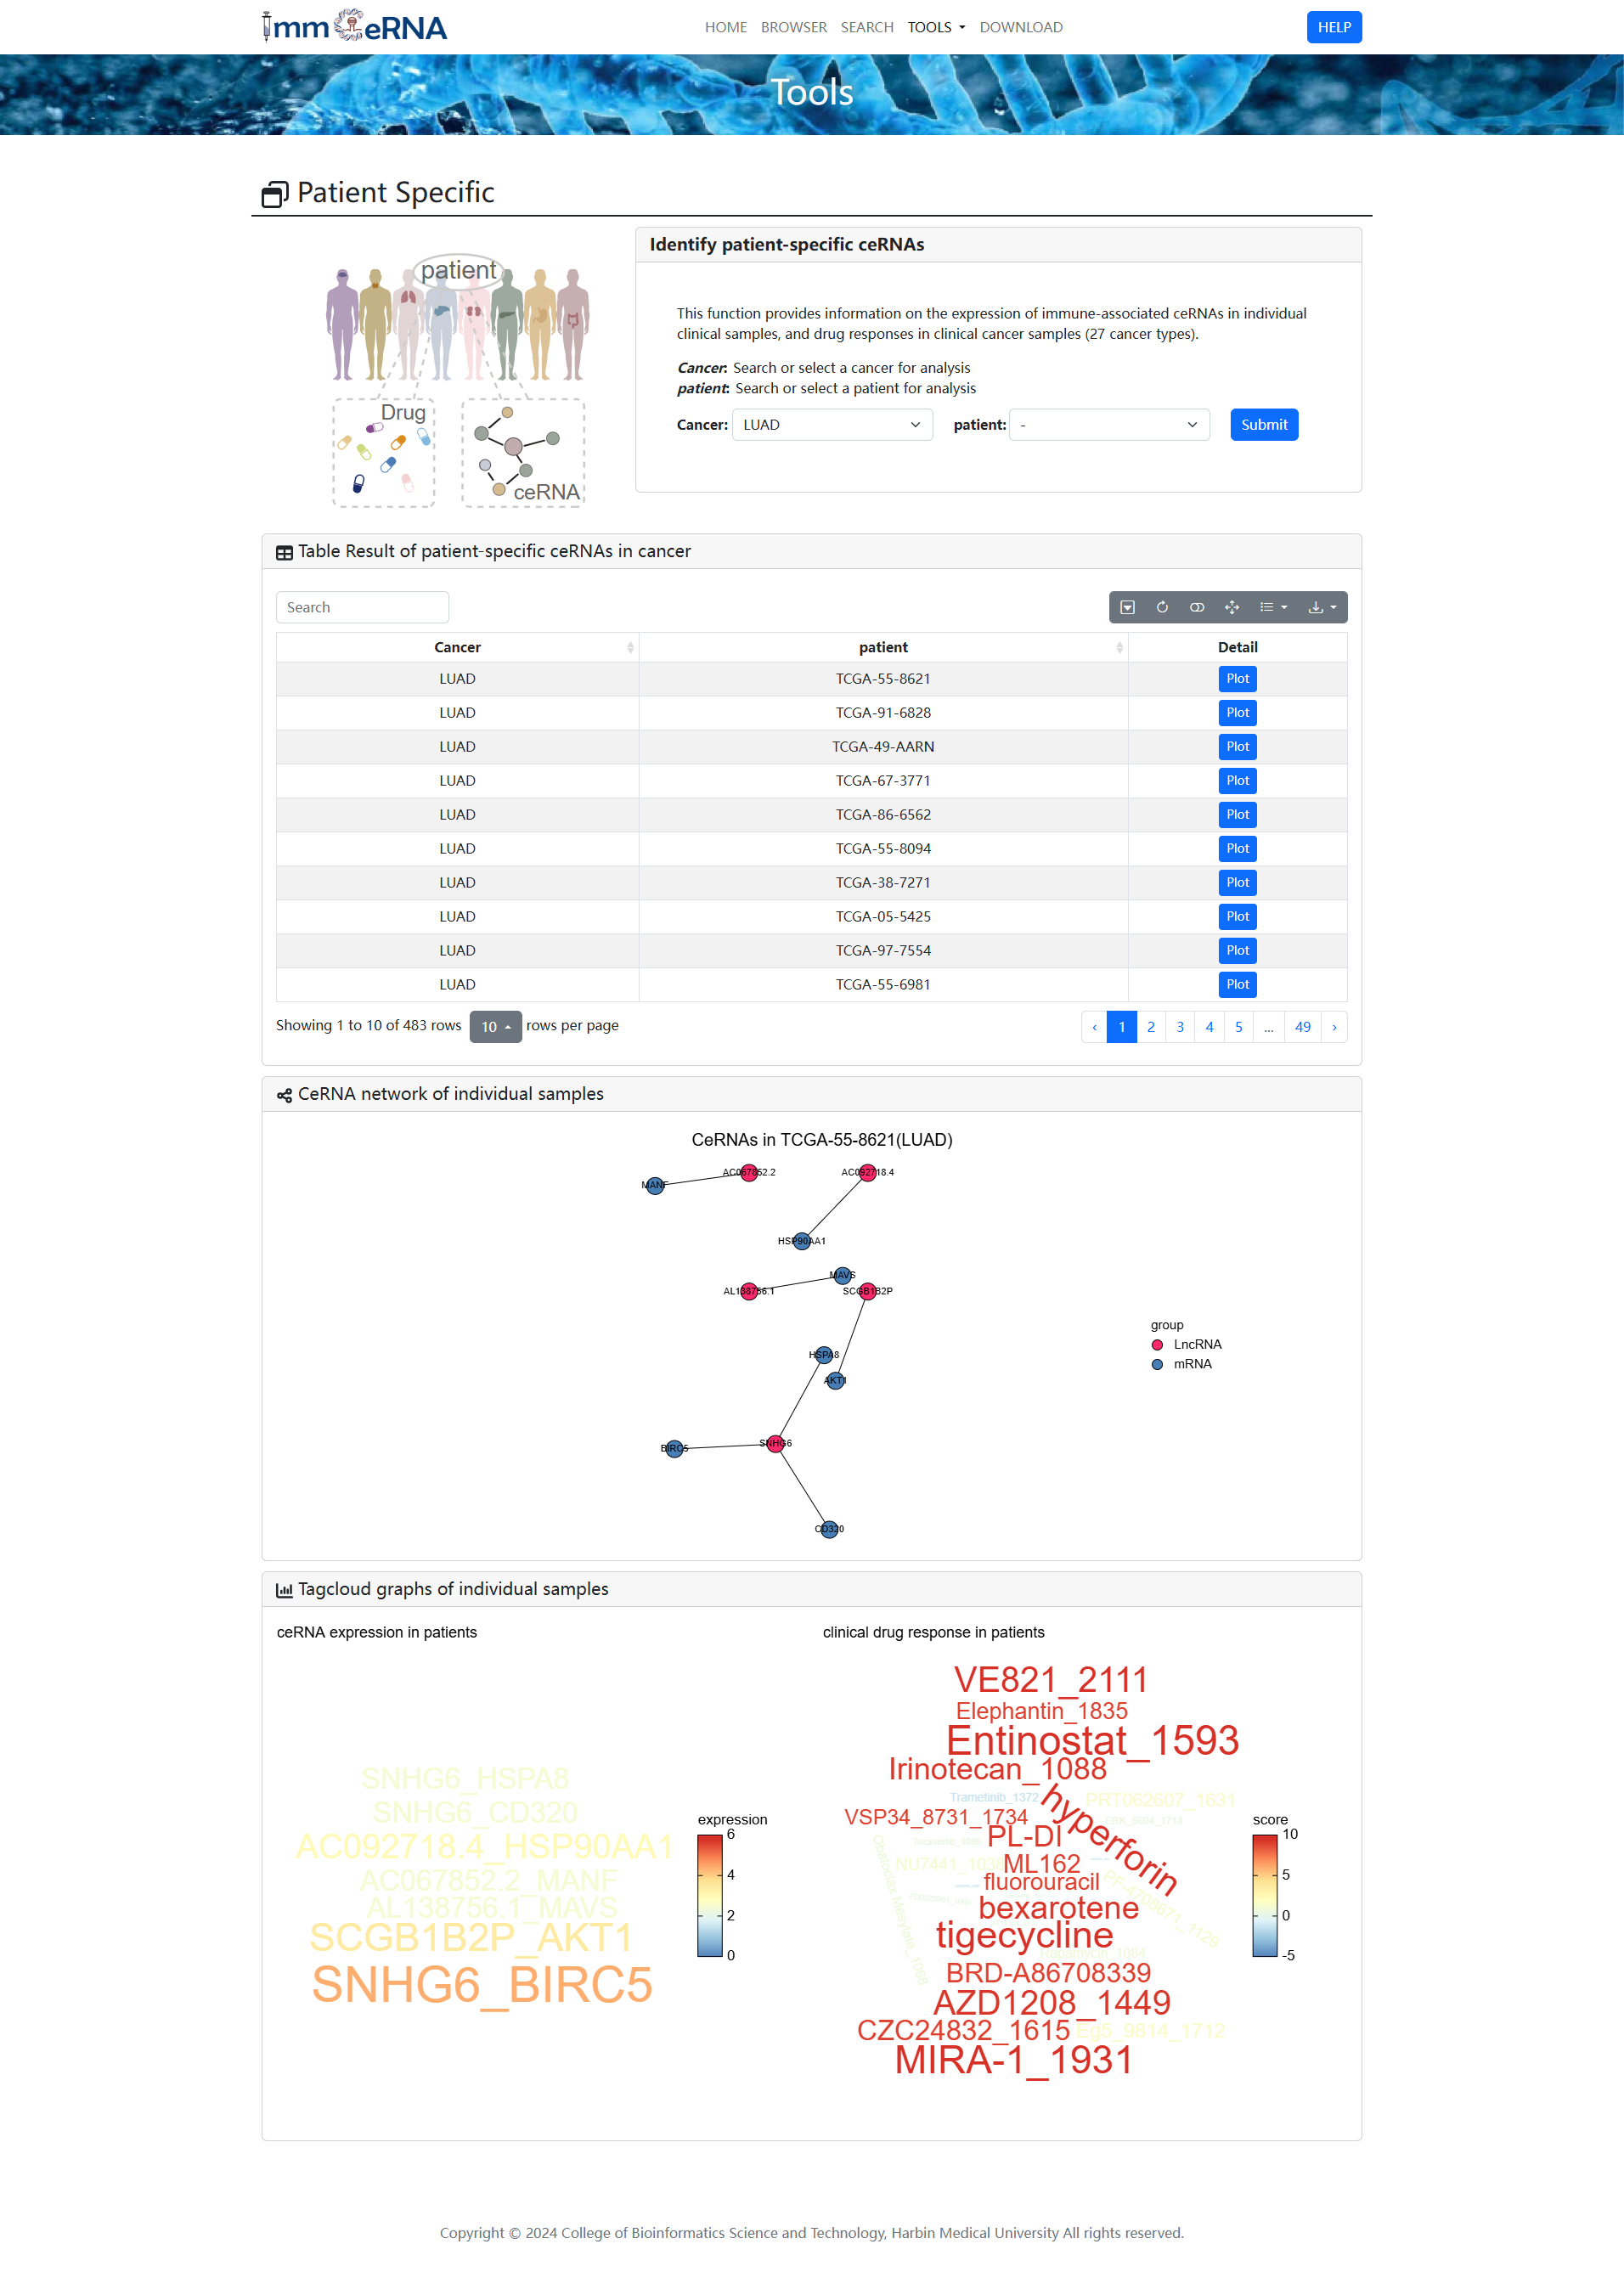
8) Patient-specific
This function provides information on
ceRNA expression and drug response in individual clinical samples at the pan-cancer level. To
ceRNA and associated drugs in a single sample, you should first search or select a clinical
sample in a cancer to analyze, and then click the "Submit" button to retrieve the
immunization-related ceRNA results and drug response profile of the clinical sample.
9) Transcription Factors
This function enables users to explore the
intricate regulatory networks governed by transcription factors (TFs) in the context of competing endogenous RNA
(ceRNA) interactions. It supports bidirectional queries: users can either input specific combinations of lncRNA,
miRNA, and mRNA to retrieve associated TFs, or start with a TF of interest to identify regulatory ceRNA networks.
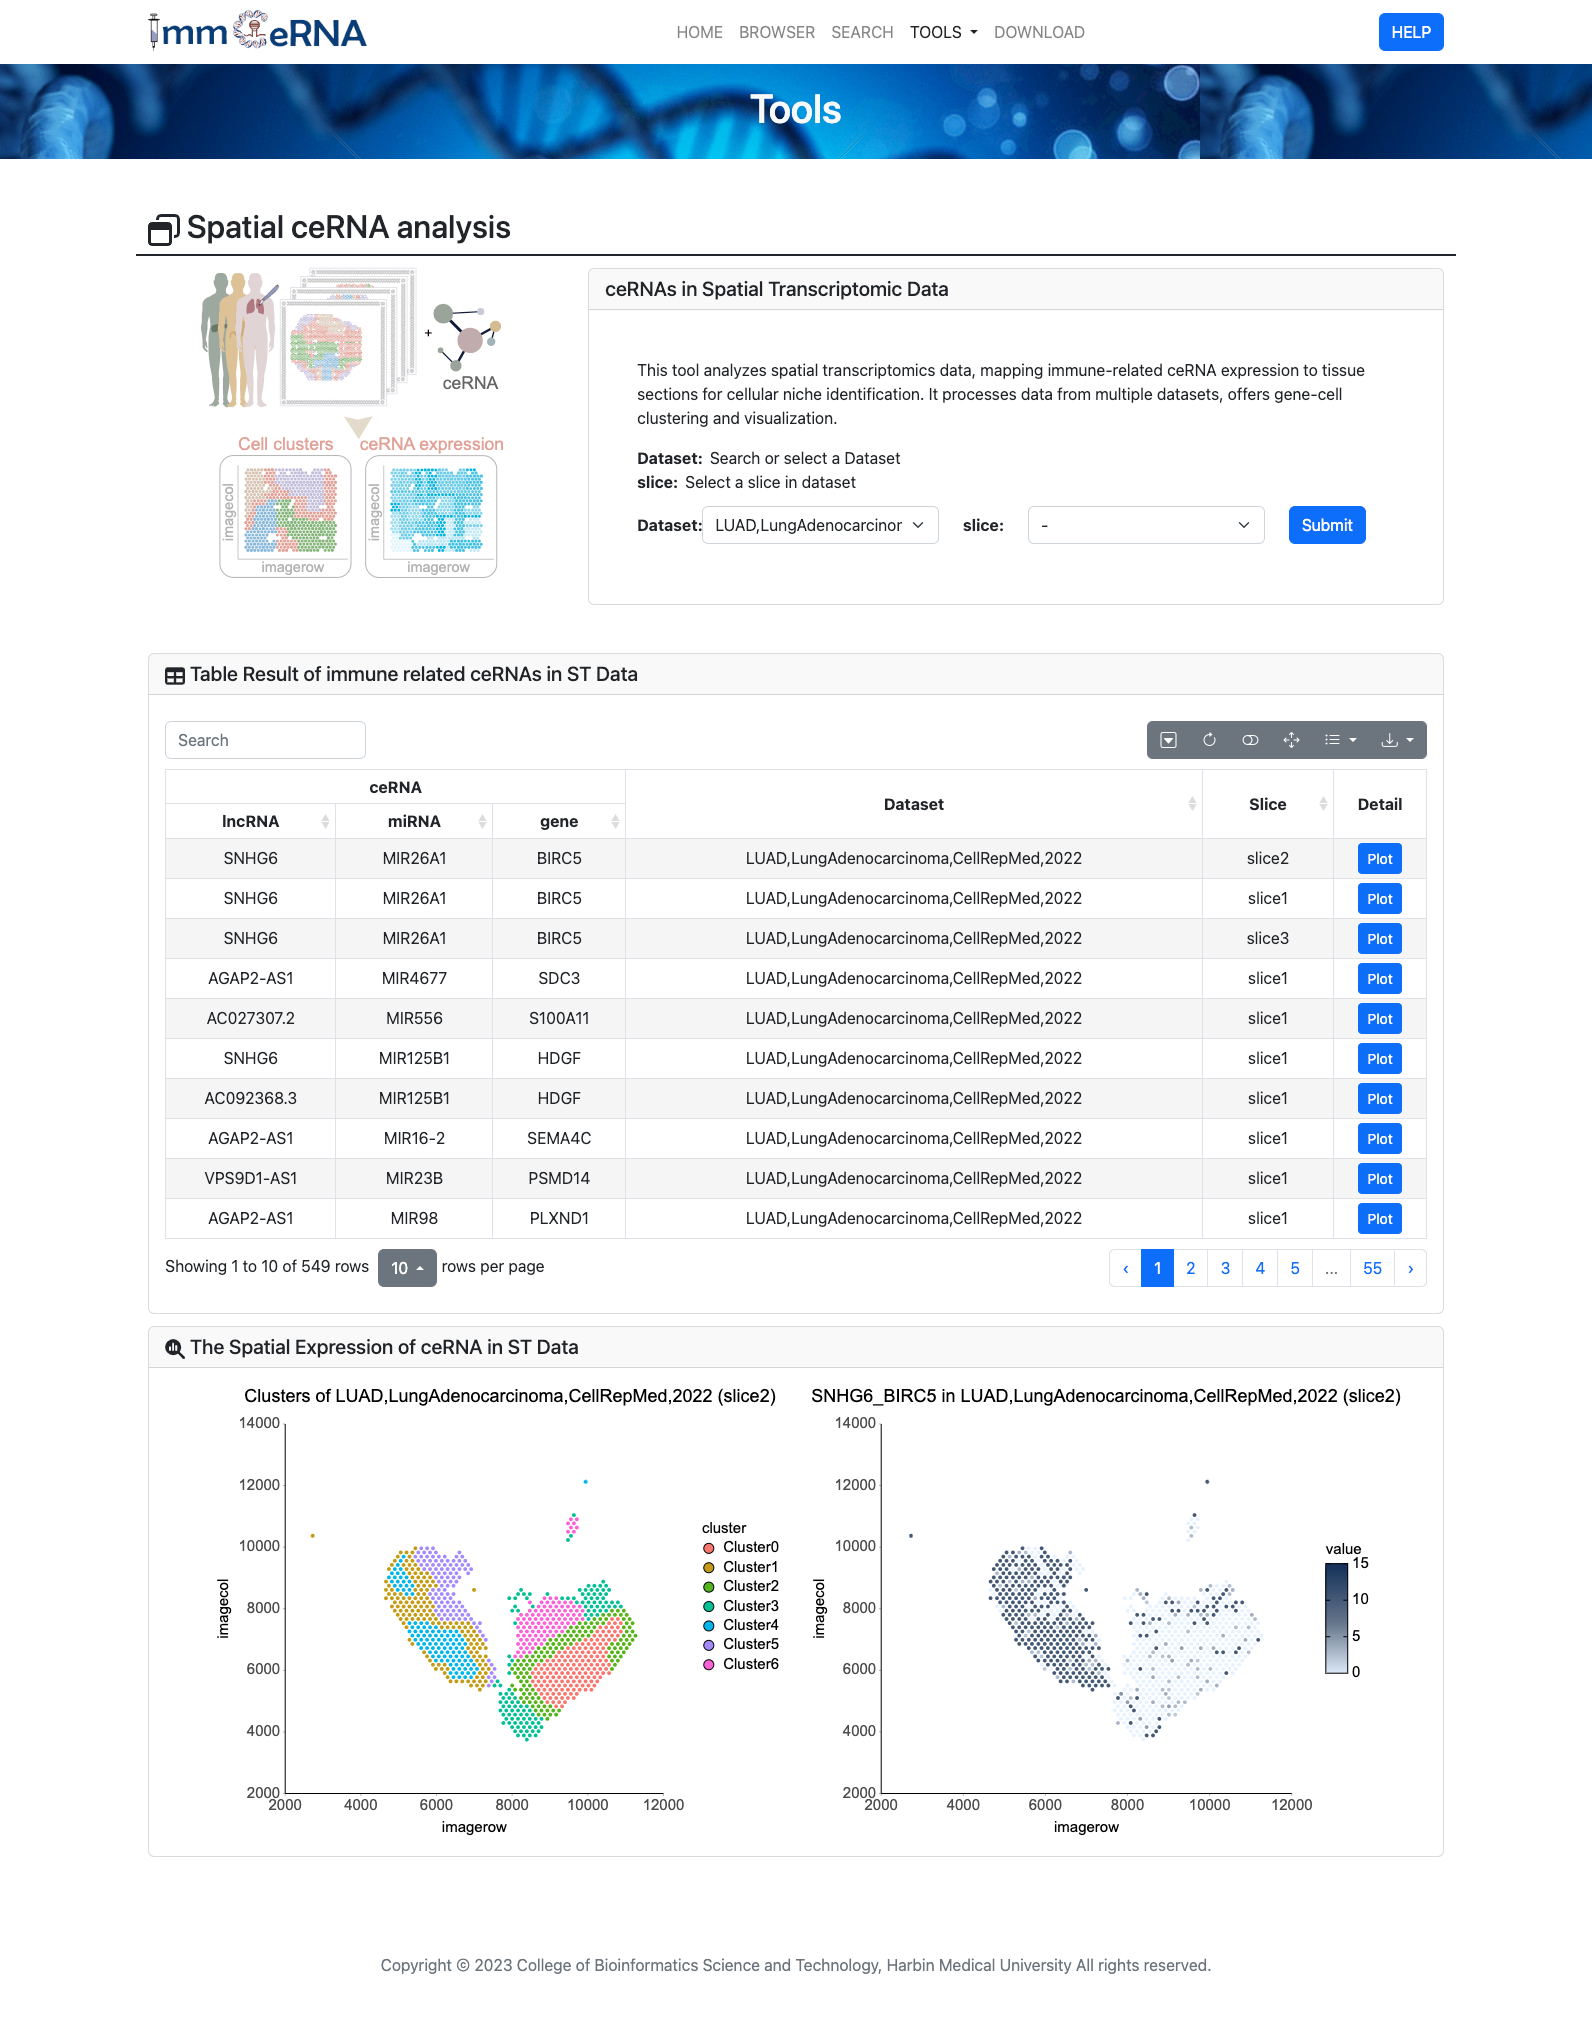
10) Spatial ceRNA
This tool is dedicated to the analysis of spatial
transcriptomics data, enabling the mapping of immune - related ceRNA expression onto tissue sections to accurately
identify cellular niches. It has the capability to handle and integrate data from diverse sources, including
different laboratories, sample types, and experimental conditions. To start the analysis, users simply upload their
spatial transcriptomics datasets, select appropriate parameters for gene - cell clustering such as the clustering
algorithm and resolution, and then click the “Submit” button.
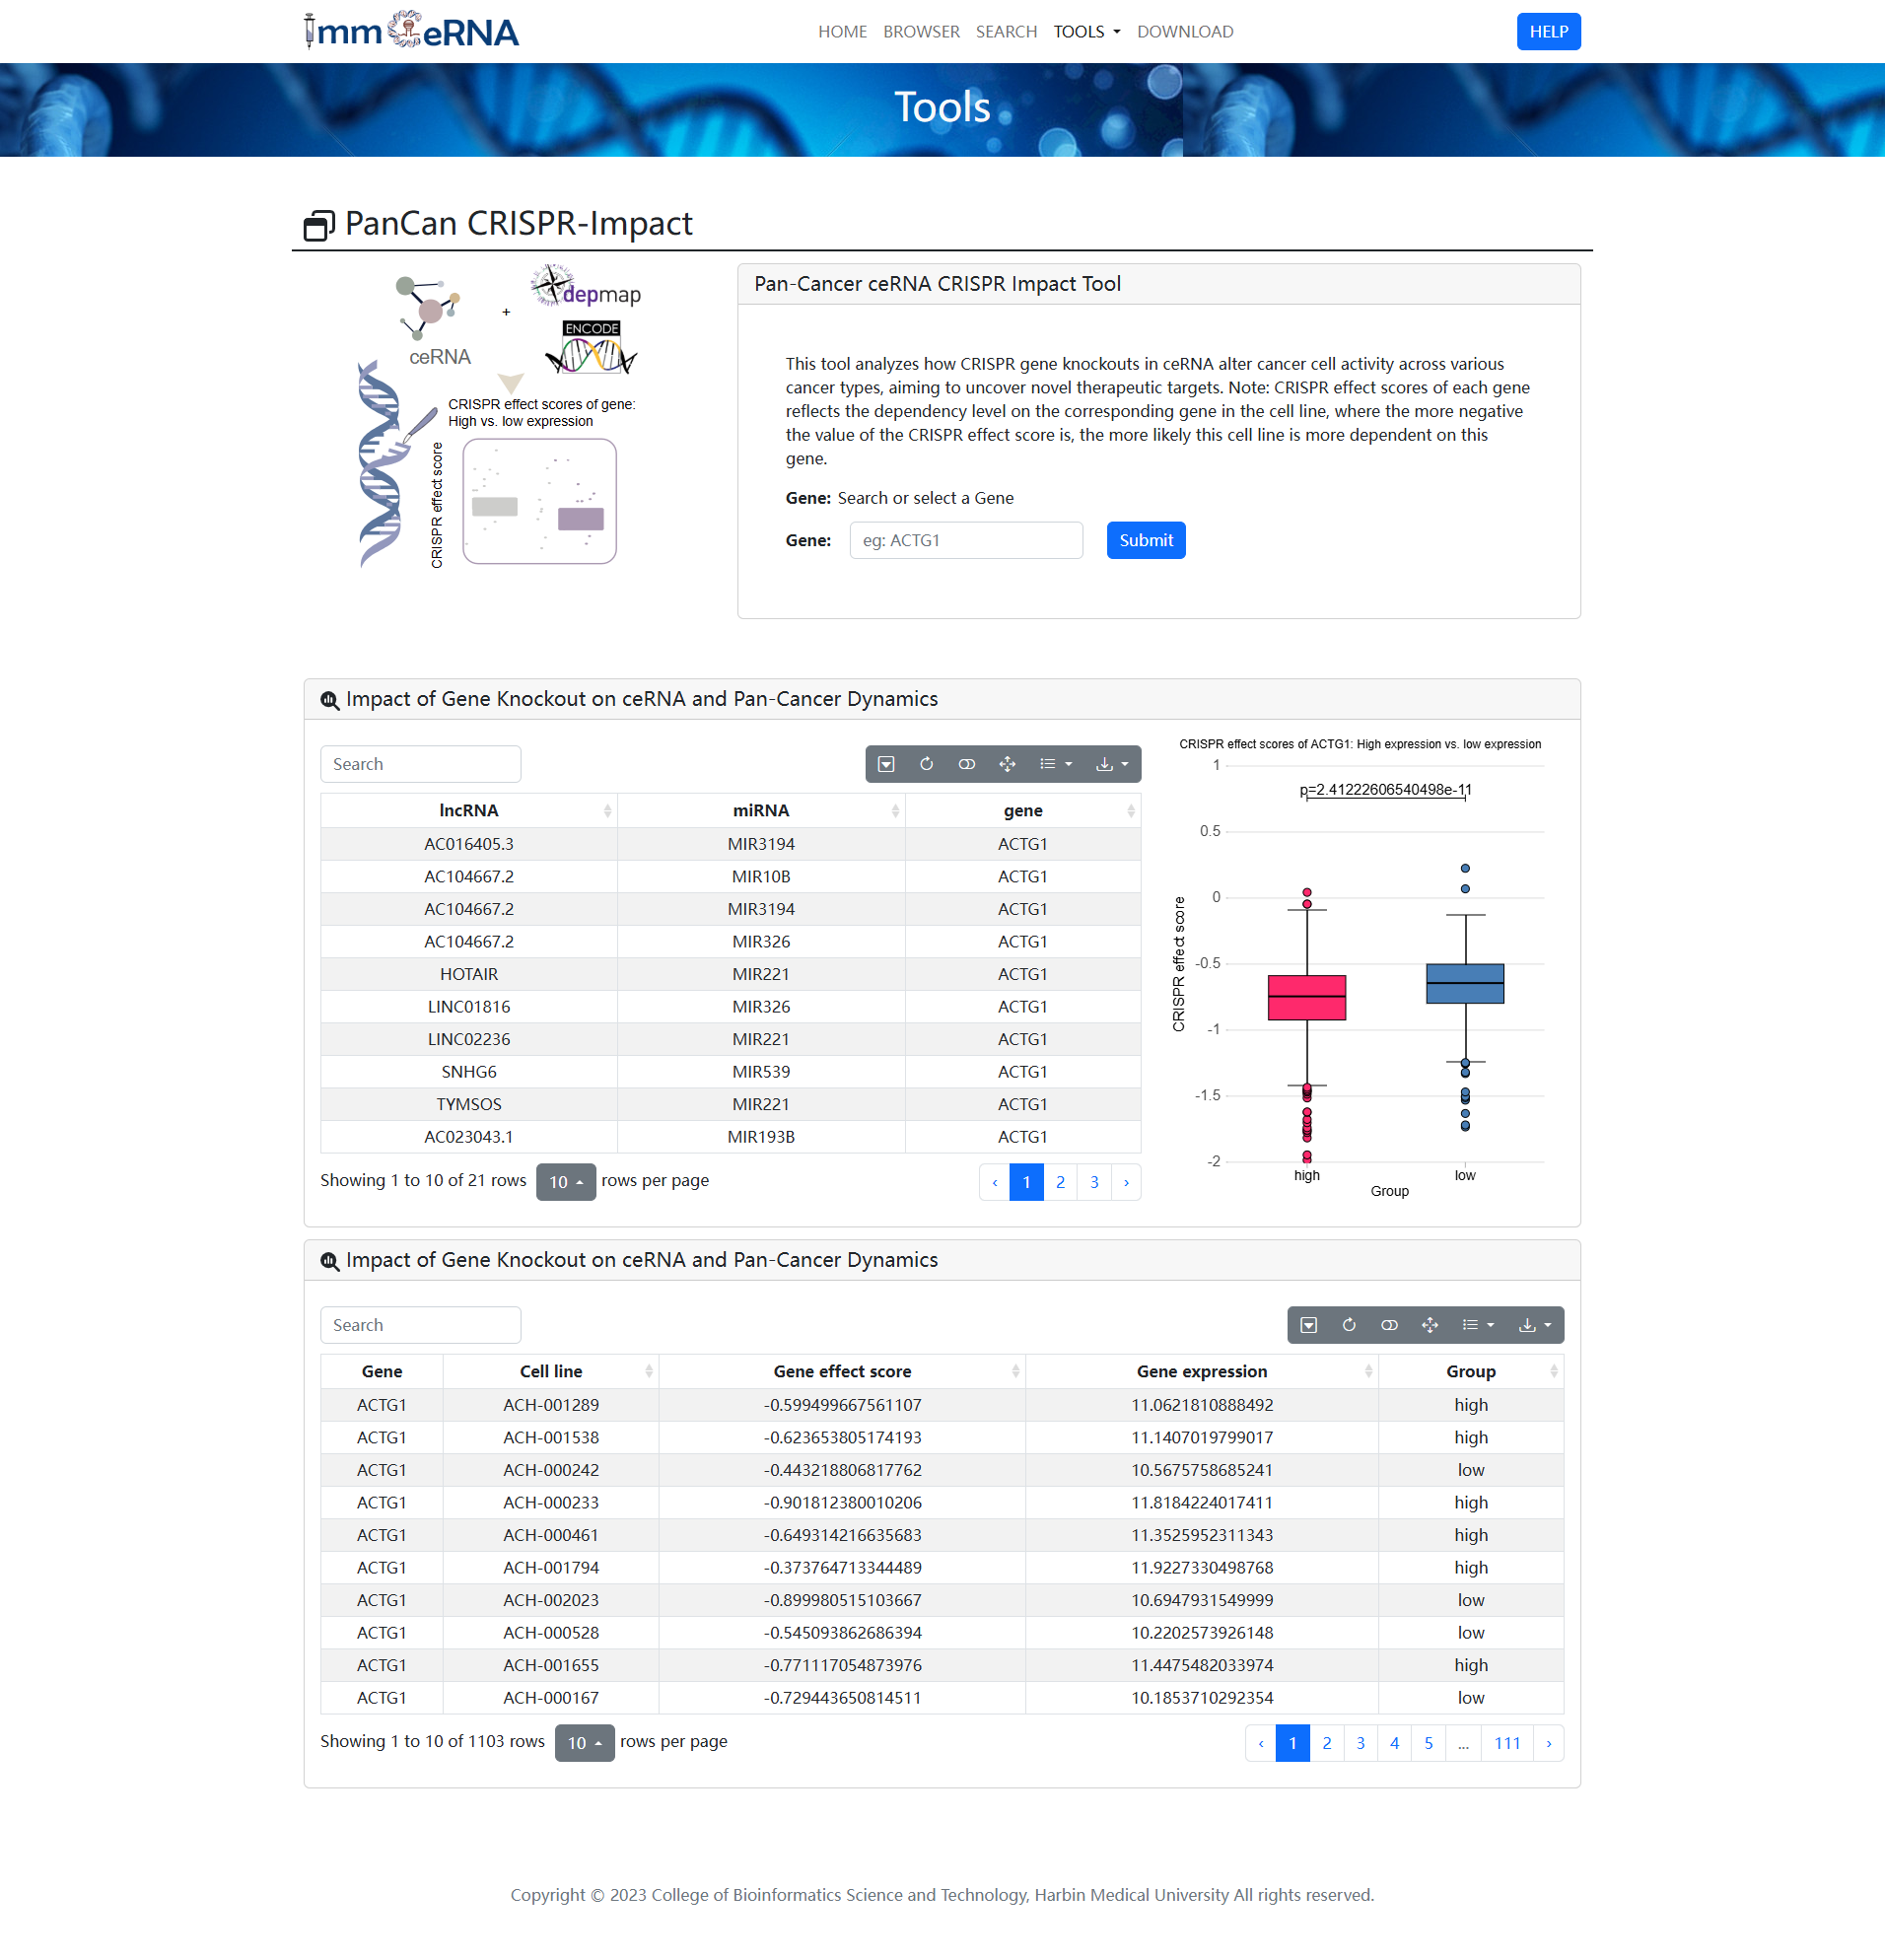
11) CRISPR Impact
This tool analyzes how CRISPR gene knockouts in ceRNA
alter cancer cell activity across various cancer types, aiming to uncover novel therapeutic targets. Note: CRISPR
effect scores of each gene reflects the dependency level on the corresponding gene in the cell line, where the more
negative the value of the CRISPR effect score is, the more likely this cell line is more dependent on this gene.
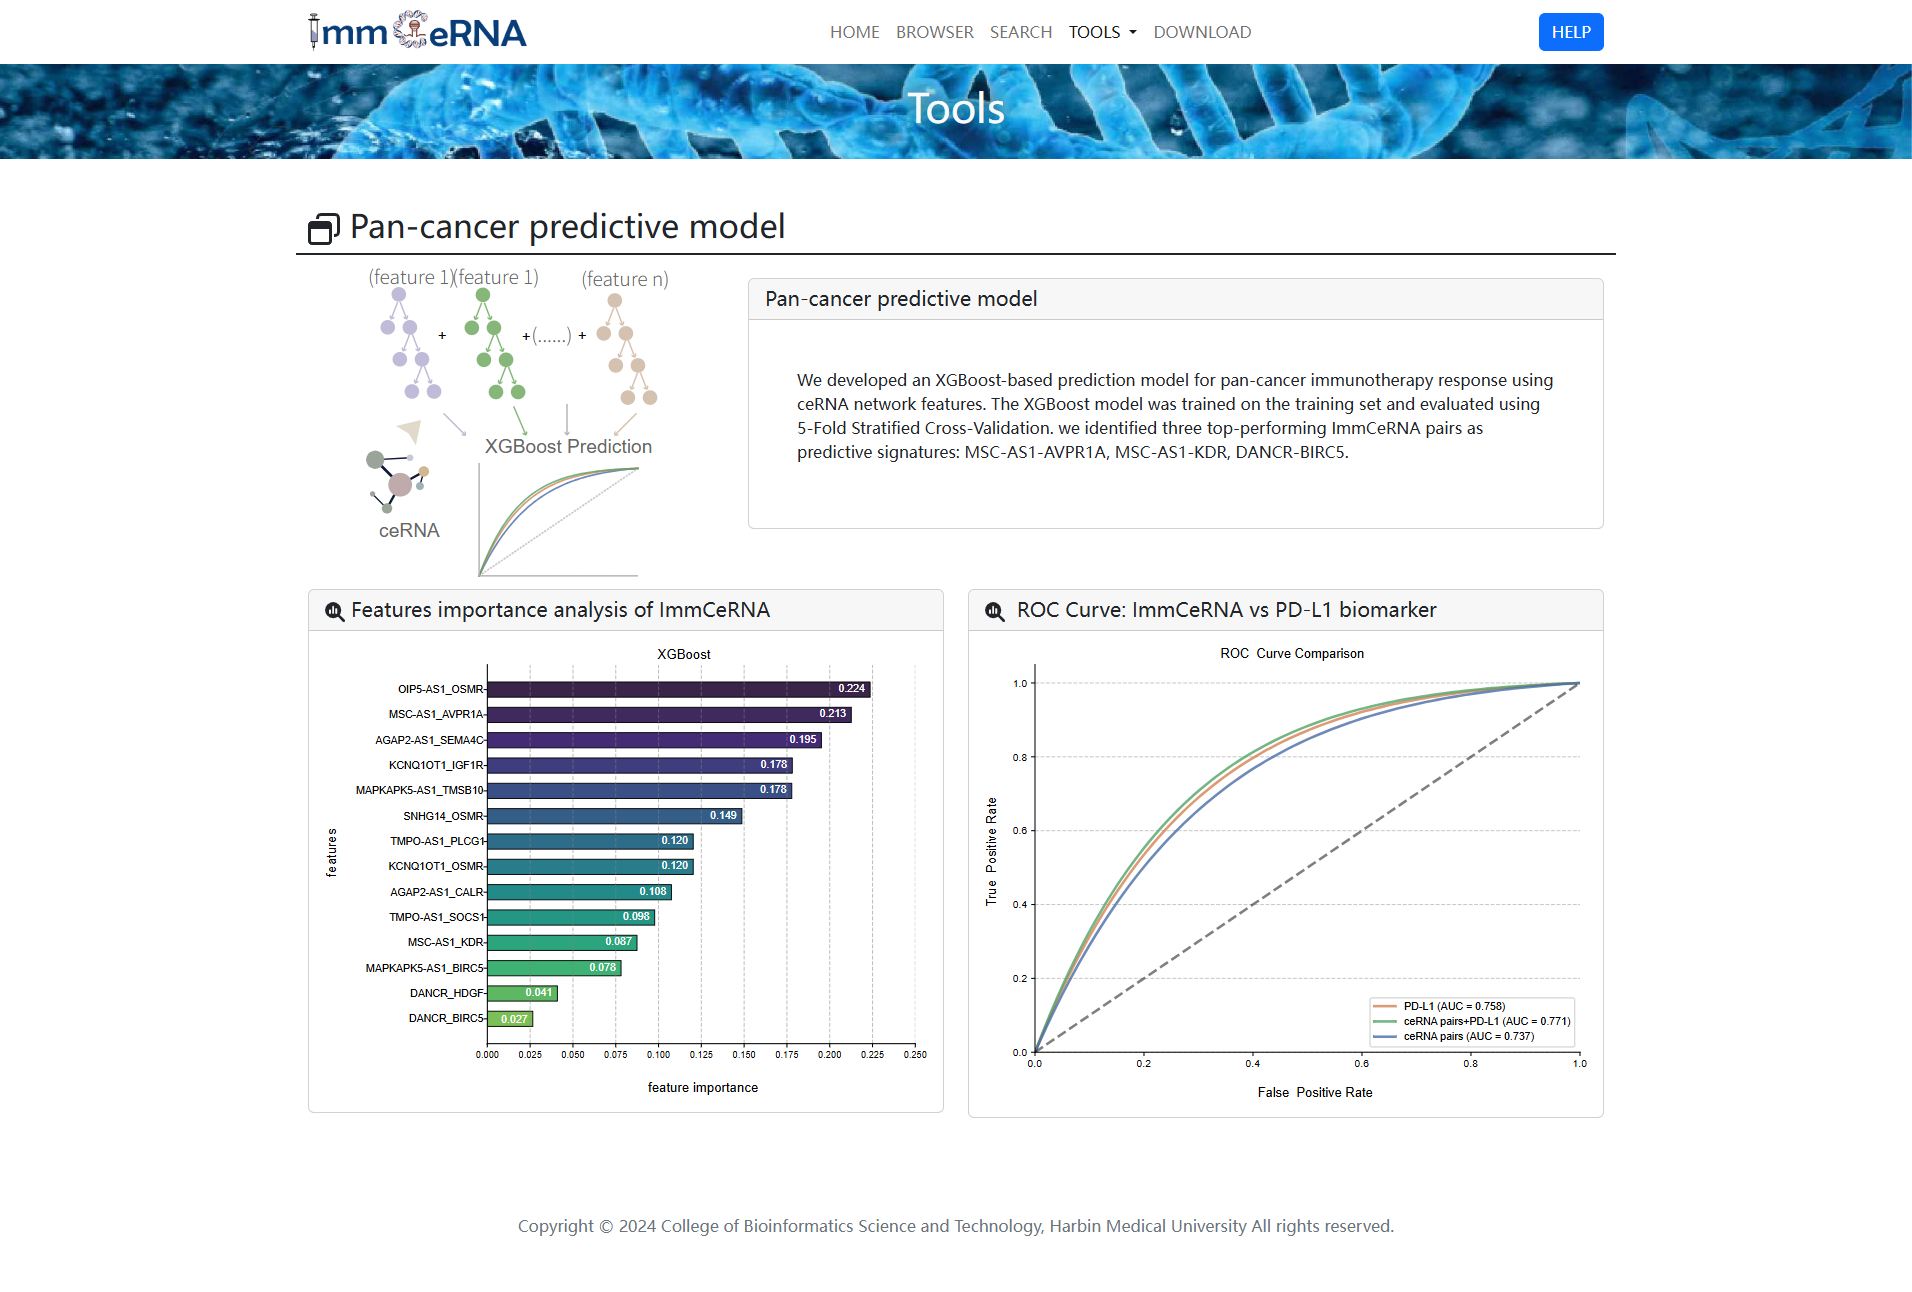
12) Predictive Model
We developed an XGBoost-based prediction model for pan-cancer
immunotherapy response using ceRNA network features. The XGBoost
model was trained on the training set and evaluated using 5-Fold Stratified
Cross-Validation. We identified 14 best-performing ImmCeRNAs as predictive signatures, including OIP5-AS1-OSMR,
MSC-AS1-AVPR1A, AGAP2-AS1-SEMA4C, KCNQ1OT1-IGF1R, and MAPKAPK5-AS1-TMSB10.
To download data in the ImmCeRNA, select the menu “Download”.
